 Earn with Nexo

NEO Price Analysis NEO / USD: Sailing Ahead
A strong upside breakout is in the charts for NEO.
- NEO is poised for a technical breakout from a falling wedge pattern
- Medium-term technical analysis still shows a bullish inverted head and shoulders pattern
- The daily time frame shows the $11.00 level as a potential upside target
NEO is poised for a technical breakout in the near-term, as the popular cryptocurrency consolidates inside its tightest three-week trading range since March this year. The NEO / USD pair is currently trading at its weakest since May 2019 and is down over sixty percent from its yearly price peak, just above the $24.00 level.
Despite reversing sharply from above the $20.00 level in late June, the cryptocurrency still trades around twenty percent higher since the start of 2019. Short-term technical analysis suggests that the NEO / USD pair could soon launch a bullish rally towards the $11.00 level, capturing a further twenty percent gain.
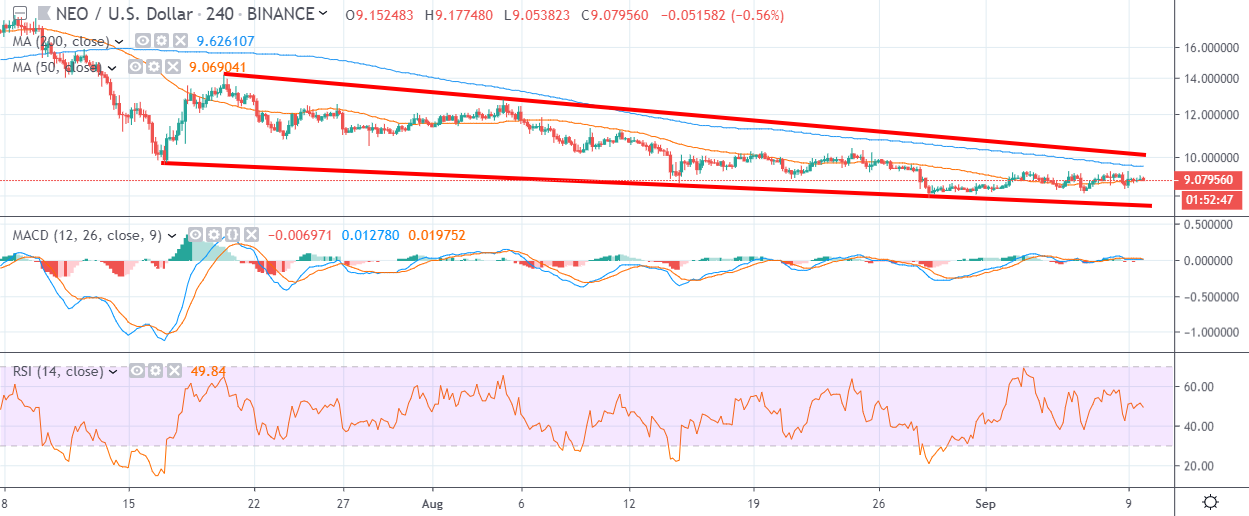
The four-hour time frame shows that a falling wedge pattern has formed, which is defined as a bullish reversal pattern. The size of the pattern suggests that the $11.00 level is the overall upside target if bulls can perform a breakout above trendline resistance, around the $9.90 level.
The overall upside target also coincides with the NEO / USD pair’s 200-day moving average, which is situated around the $11.00 level. In order to accomplish the upside objective, bulls need to continue to defend the $7.50 to $8.00 support area. Failure under this key area will be extremely bearish from a technical perspective.
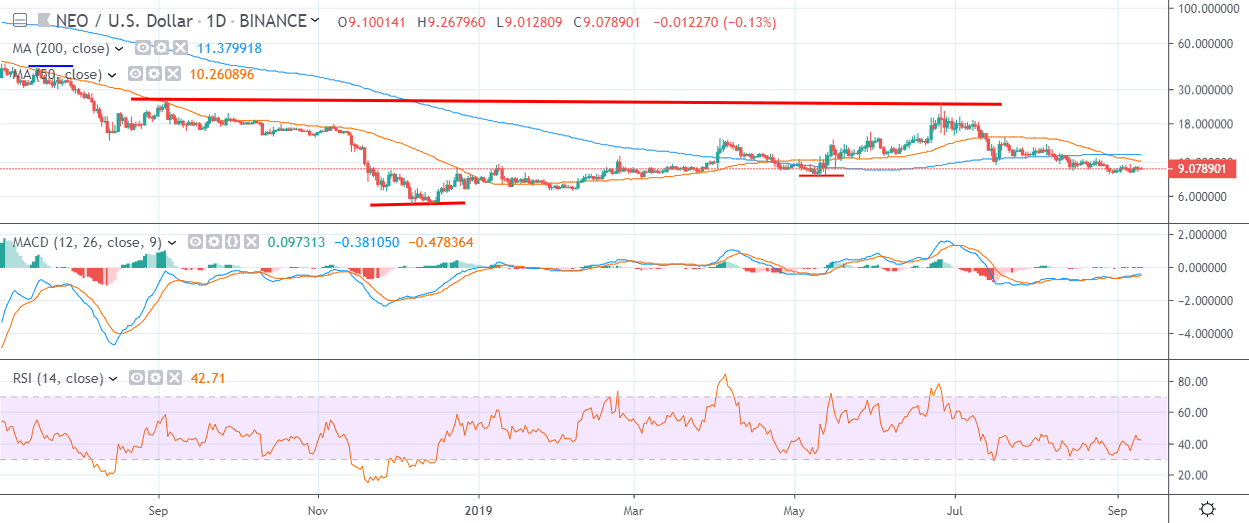
The daily time frame continues to highlight a large inverted head and shoulders pattern with the neckline of the bullish pattern located some 60 percent away from current pricing, around the $14.00 level.
The daily time frame also highlights the $15.00 level as a potential upside target, if bulls can eventually break above the NEO / USD pair’s 200-day moving average.
According to the latest sentiment data from TheTIE.io, the short-term sentiment towards NEO is bullish, at 70.00 %, while the overall long-term sentiment towards the cryptocurrency is negative, at 38.00%.
Upside Potential
The four-hour time frame is showing that the NEO / USD pair can quickly advance towards the $11.00 level if bulls can breakthrough strong technical resistance around the $9.50 level.
The daily time frame highlights that once above the $11.00 resistance level, further bullish advancement towards the $15.00 level then remains possible.
Downside Potential
The four-hour time frame shows that if sellers force a bearish breakout below the $7.50 level then the NEO / USD pair could come under severe selling pressure towards the $6.00 level.
The daily time frame currently highlights the $7.50 and $5.50 levels as the main technical support areas. A move under the $5.50 level would invalidate the large inverted head and shoulders pattern on the daily time frame.
Summary
NEO may be getting ready for a strong breakout move, as the cryptocurrency consolidates inside an extremely narrow range band.
Short-term technical analysis suggests that the NEO / USD pair could soar towards the $11.00 level if bulls can breakout from the well-defined falling wedge pattern.
For a quick look into NEO, check out our coin guide.