
Shutterstock cover by Marcos E Ramos Ponciano
Oracle Tokens Chainlink, Band Protocol Surge to New Highs
Decentralized oracles token LINK has entered price discovery mode while BAND is quickly catching up.
A spike in profit-taking may strike Chainlink in the near term leading to a pullback, while Band Protocol seems to have the buying pressure needed to make new all-time highs.
Chainlink Investors Rejoice in Profits
Chainlink’s market value has risen by nearly 74% over the past month, going from $29.50 to a new all-time high of $51.30. Such an impressive bull rally seems to have kicked off after LINK broke out of a symmetrical triangle on Mar. 31.
Based on the height of the triangle’s y-axis, the decentralized oracles token was poised for a 79% upswing toward the 200% Fibonacci retracement level at $53.50 – measured from the Feb. 20 high of $37 to the Feb. 23 low of $20.70.
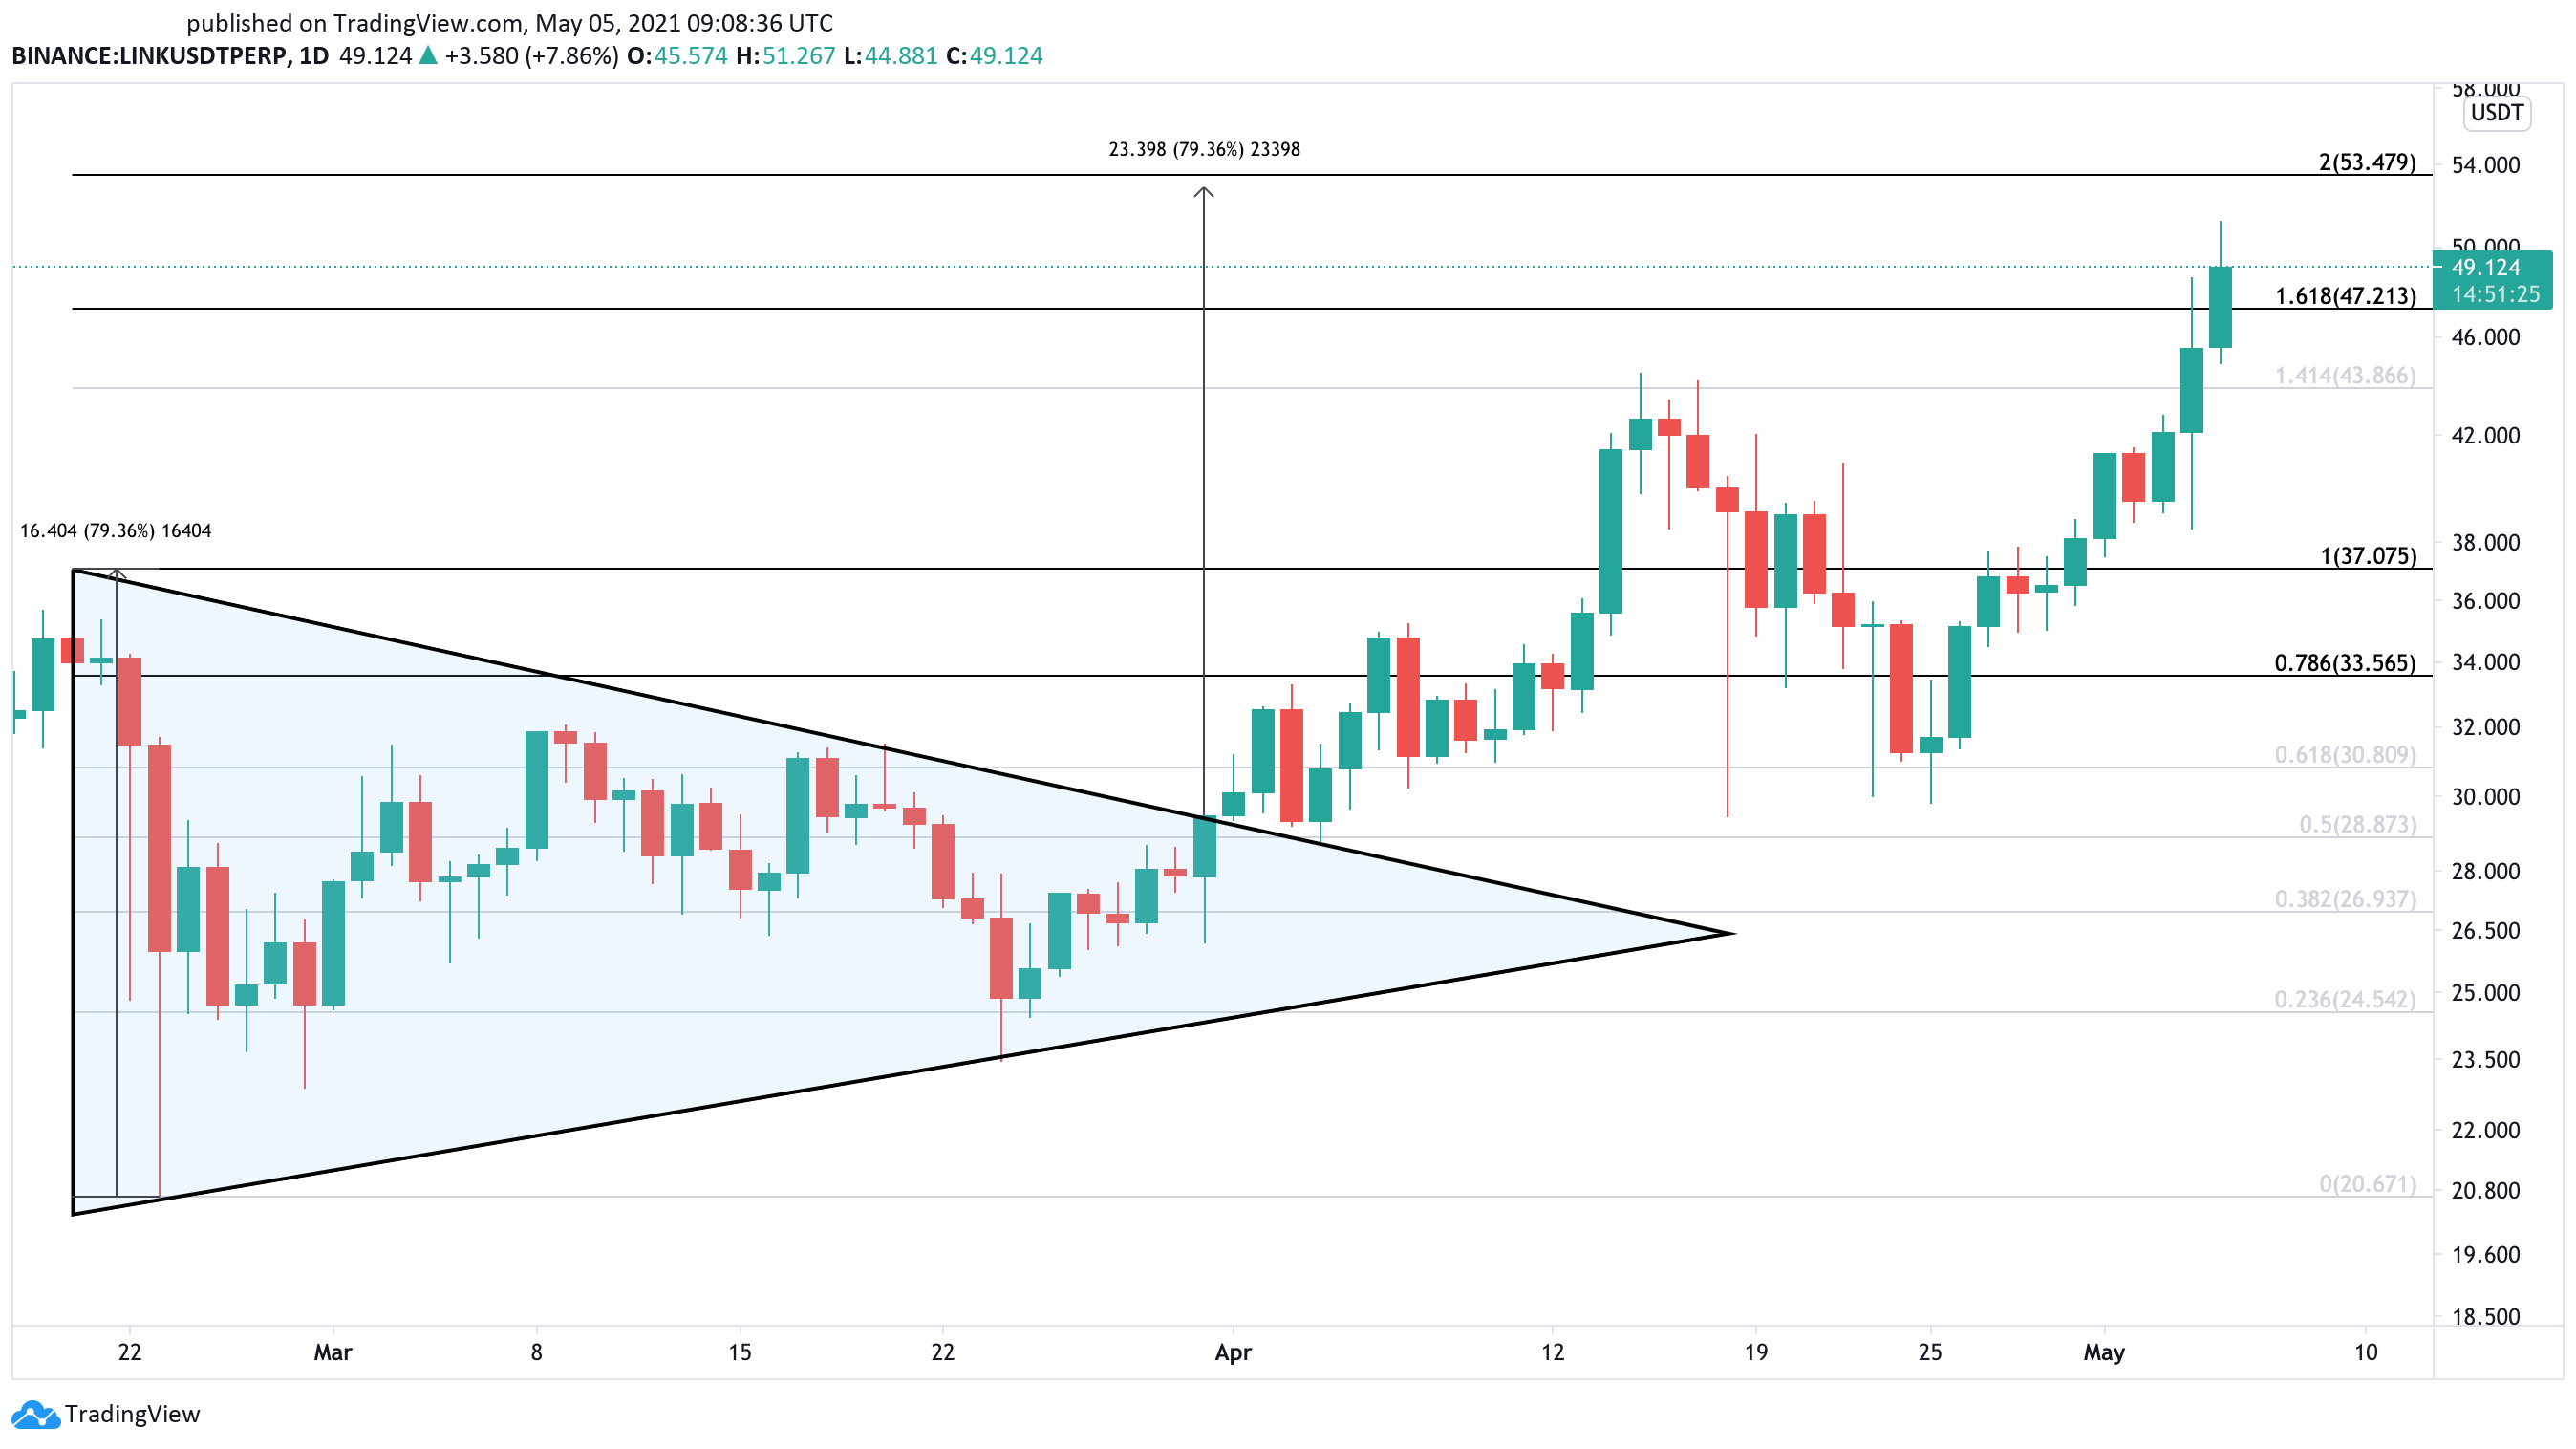
Now that the symmetrical triangle’s target has nearly been hit, the Market Value to Realized Value (MVRV) points to a potential sell-side pressure moving forward. This fundamental indicator measures the average profit or loss of all addresses that acquired LINK tokens within a specific time frame.
Chainlink’s 30-day MVRV ratio currently sits at nearly 30%, suggesting most of the market participants who bought LINK in the past 30 days are on average up by 30% on their initial investment.
Each time the 30-day MVRV has moved above 48% in the last three months, a bearish impulse tends to follow since most of the tokens in circulation are at a profit. The higher the MVRV ratio becomes, the higher the selling pressure that usually follows.
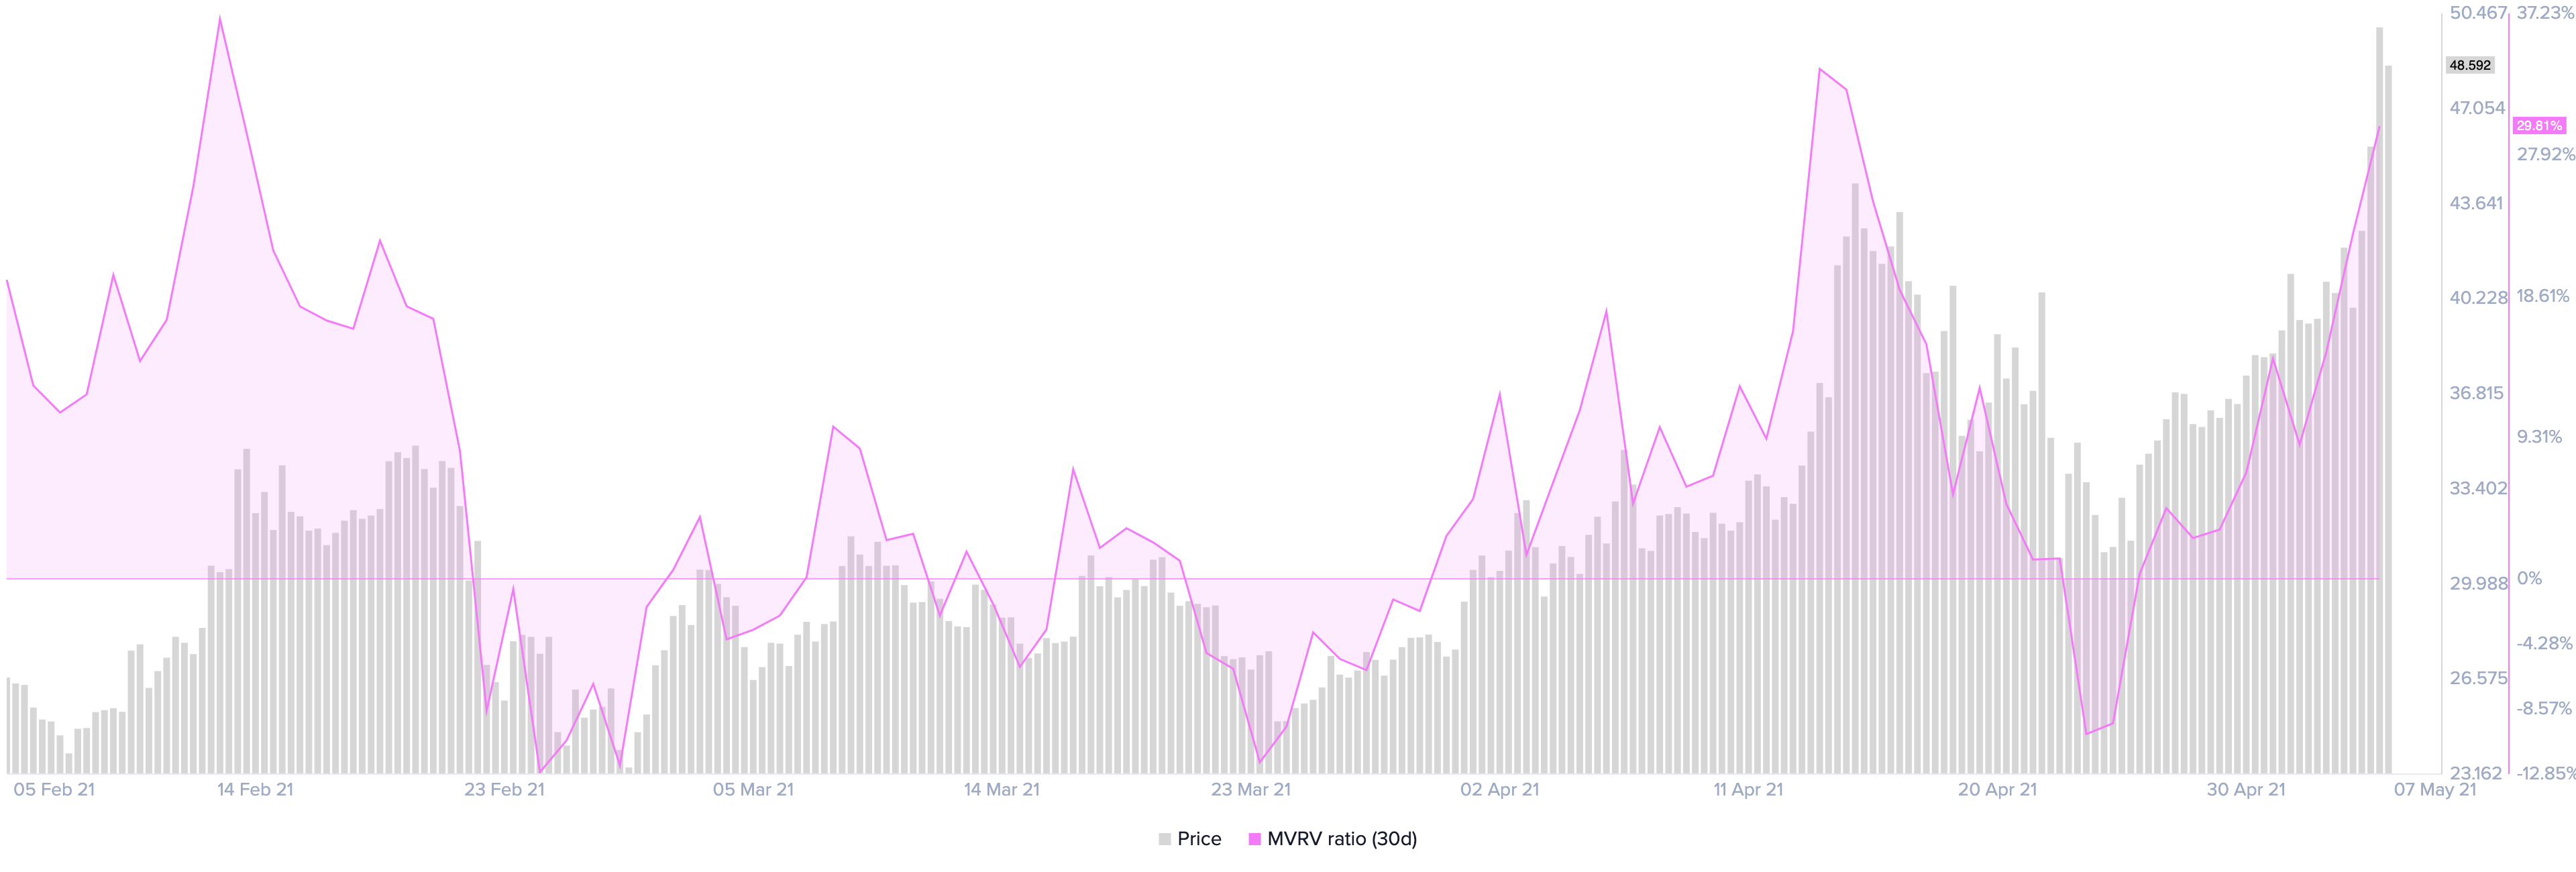
With that in mind, some caution would be advised in the coming days. Even though LINK’s 30-day MVRV may have more room to go up, the fact that it is now facing local resistance may suggest an increased risk of a short-term price correction.
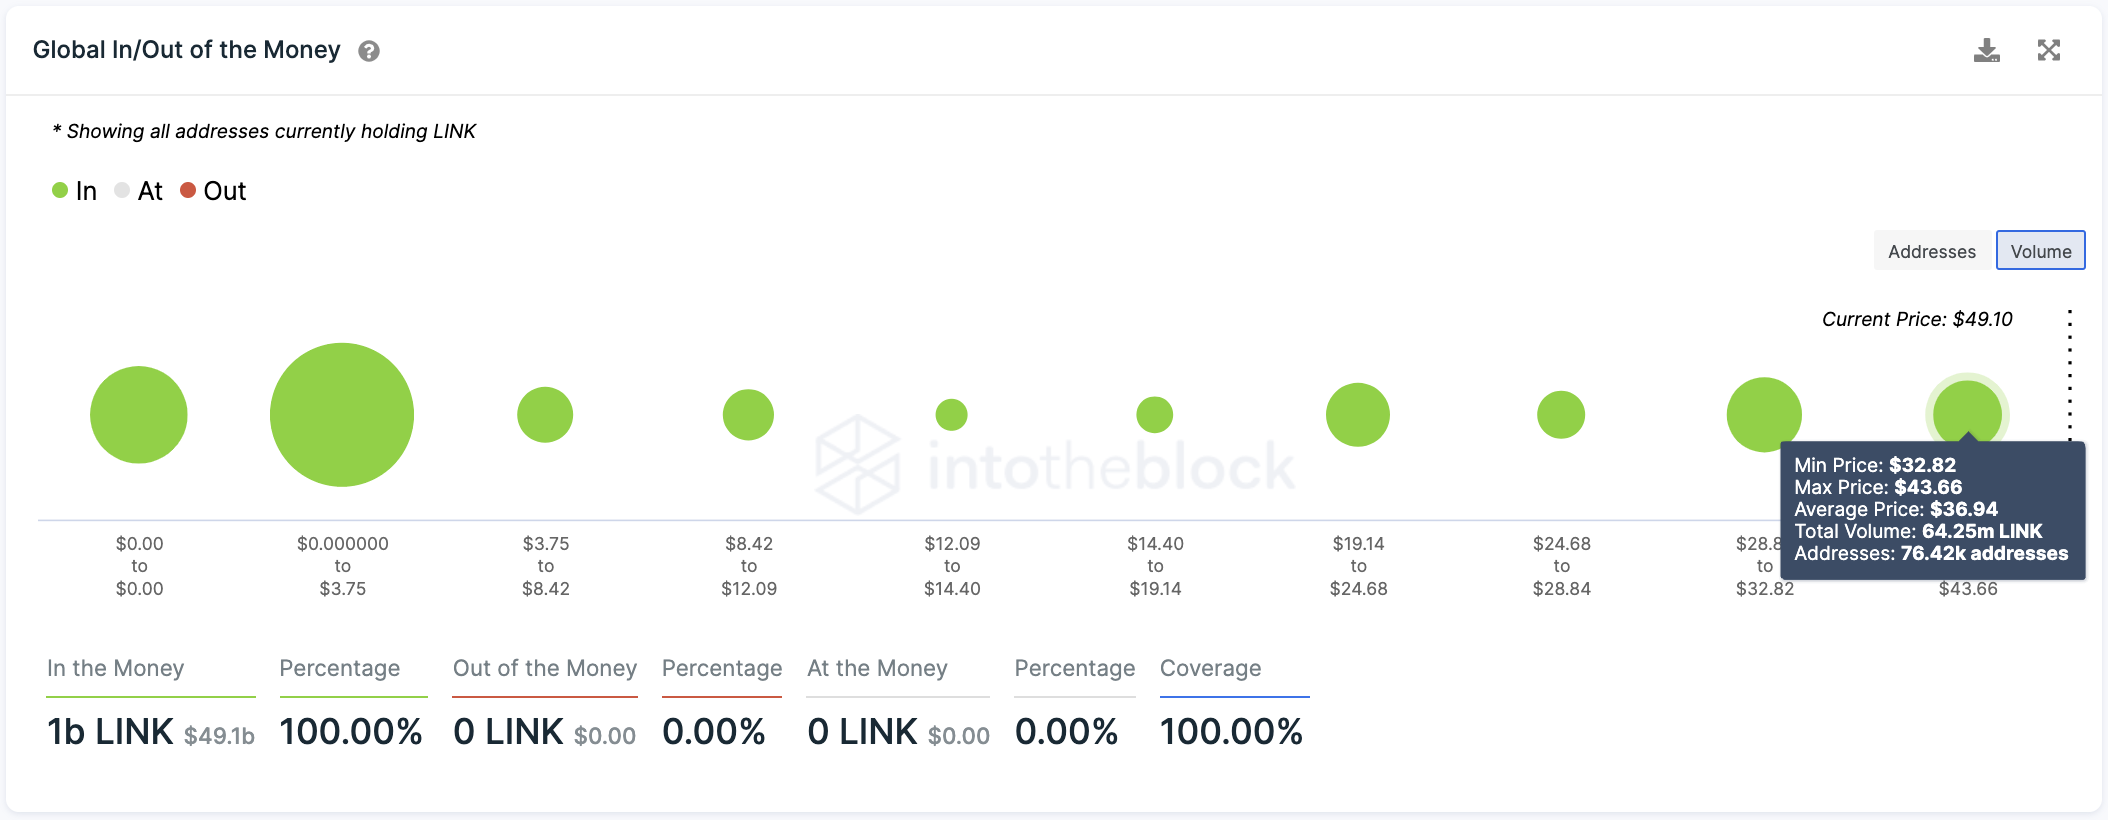
IntoTheBlock’s “Global In/Out of the Money” (GIOM) model reveals that Chainlink sits on top of a massive demand wall that could keep falling prices at bay in the event of a retracement.
Based on this on-chain metric, more than 76,400 addresses had previously purchased over 64 million LINK between $43.70 and $32.80. Holders within this price range may try to do anything to prevent their investments from going “Out of the Money.” They may even buy more tokens to allow prices to rebound.
Given the lack of supply barriers ahead, there is a slight chance that Chainlink will be able to shrug off the sell signals and continue rising toward higher highs.
Investors must watch out for a candlestick close above the recent peak of $51.30 as it will invalidate the pessimistic outlook and result in an upswing toward $60 or higher.
Band Protocol Whales Buy en Masse
Band Protocol suffered a significant correction after making a new all-time high of $23.40 on Apr. 15. Its market value dropped by more than 50%, shedding more than 12 points within three days.
Despite the catastrophic dowsing, it seems that large “whale” investors took advantage of the uncertainty to buy BAND at a discount.
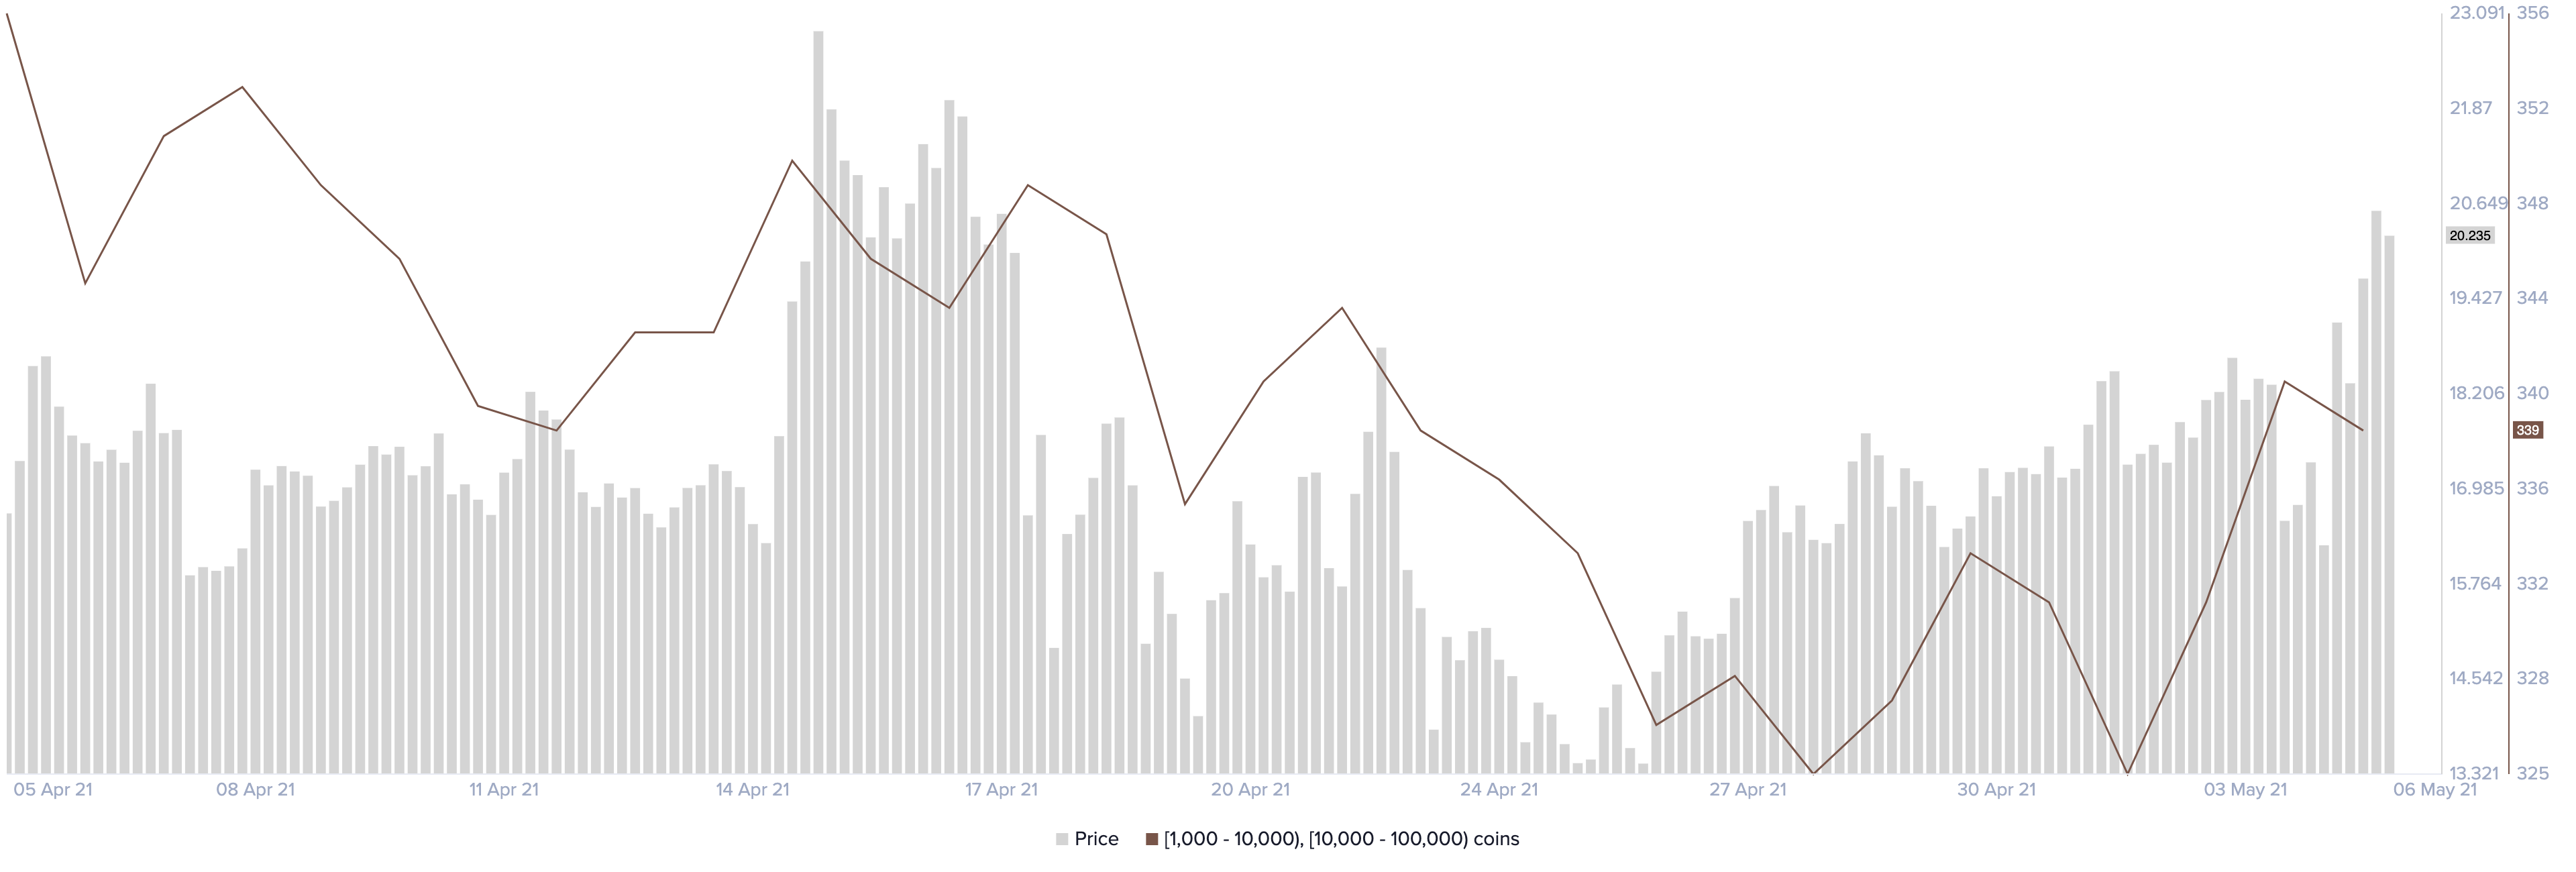
Band Protocol’s supply distribution chart shows that the number of addresses with 1,000 to 100,000 BAND rose by 4.90% over the past week. Roughly 16 whales joined the network within that period.
The sudden spike in the number of whales on the network may seem insignificant at first glance. However, when considering these high-net-worth individuals hold up to $2 million in BAND, the increase in buying pressure can translate into millions of dollars.
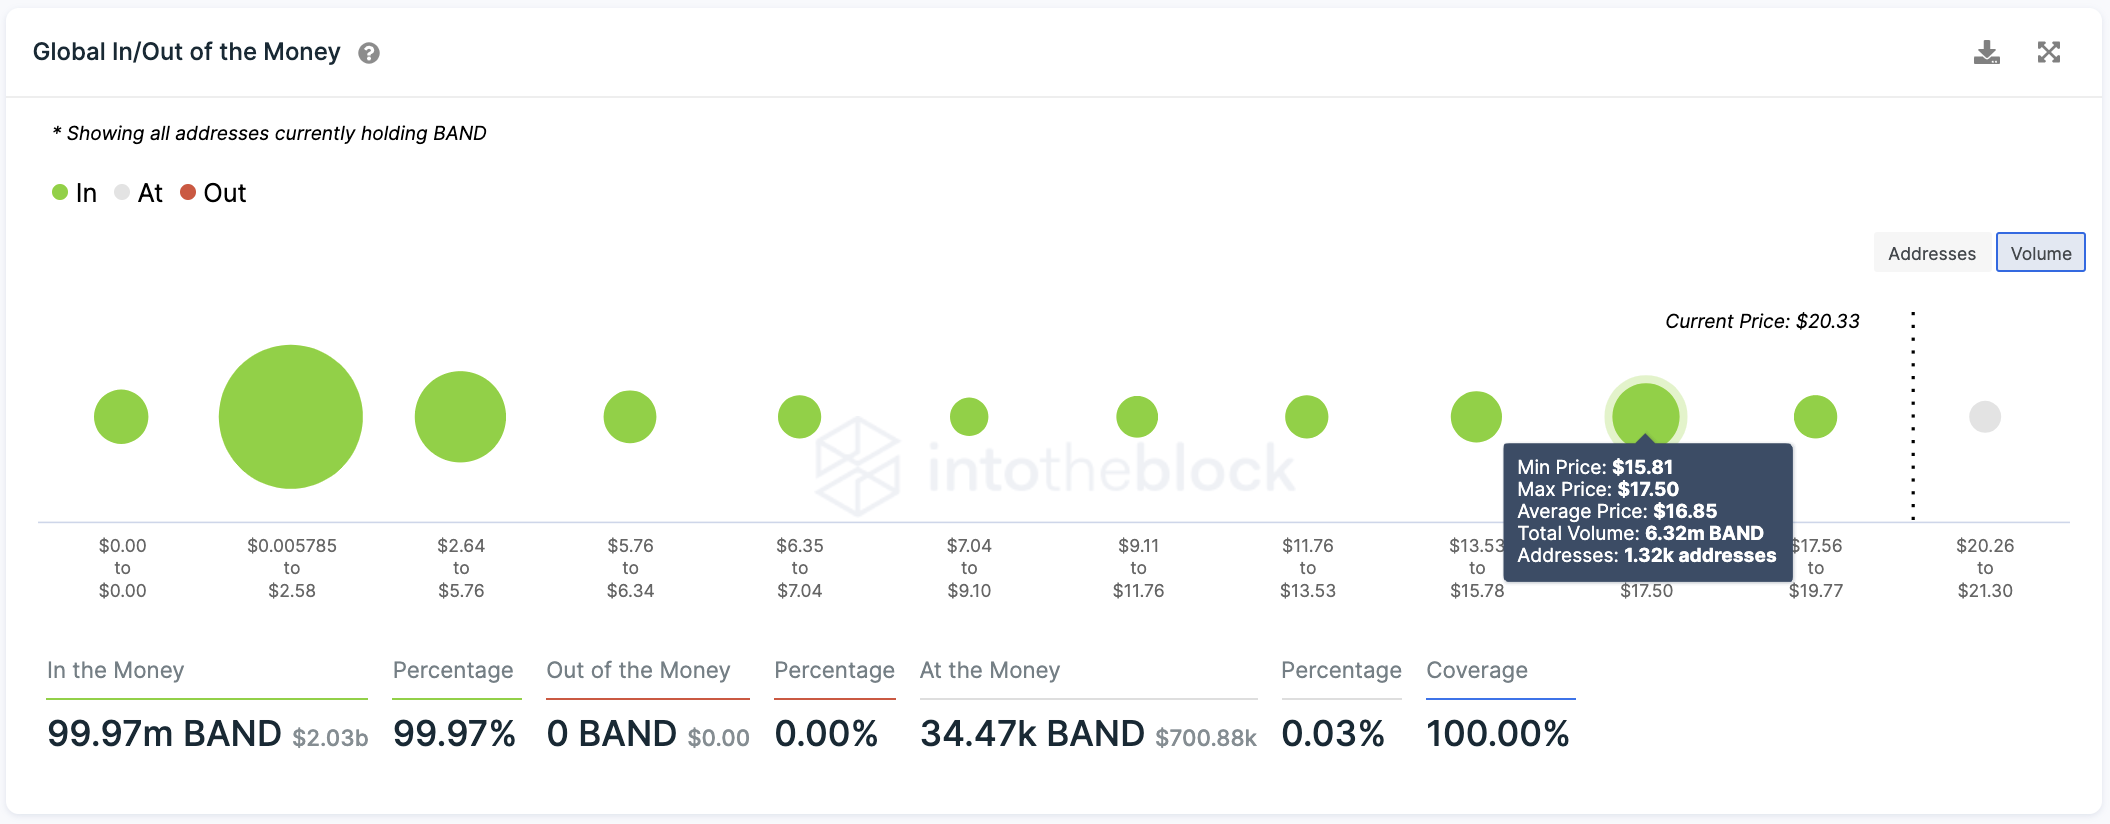
IntoTheBlock’s GIOM model suggests that most of the tokens recently purchased by whales were acquired at an average price of $16.90. Here, transaction history shows that 1,300 addresses hold more than 6.30 million BAND.
As such, the $16.90 demand wall can be seen as the most extreme downside risk in the event of a sell-off.
While Band Protocol’s downside potential seems capped by the $16.90 support level, the technicals suggest that it has plenty of room to go up. BAND appears to be breaking out of a cup and handle formation that had been developing in its weekly chart since mid-August 2020.
If buy orders continue to pile up, the oracles token could surge by 370% toward the 178.6% or 200% Fibonacci retracement level – measured from Nov. 4, 2020, low of $3.80 to Feb. 13, 2021, high of $20.80.
These potential interest areas sit at $79 and $113.50, respectively.
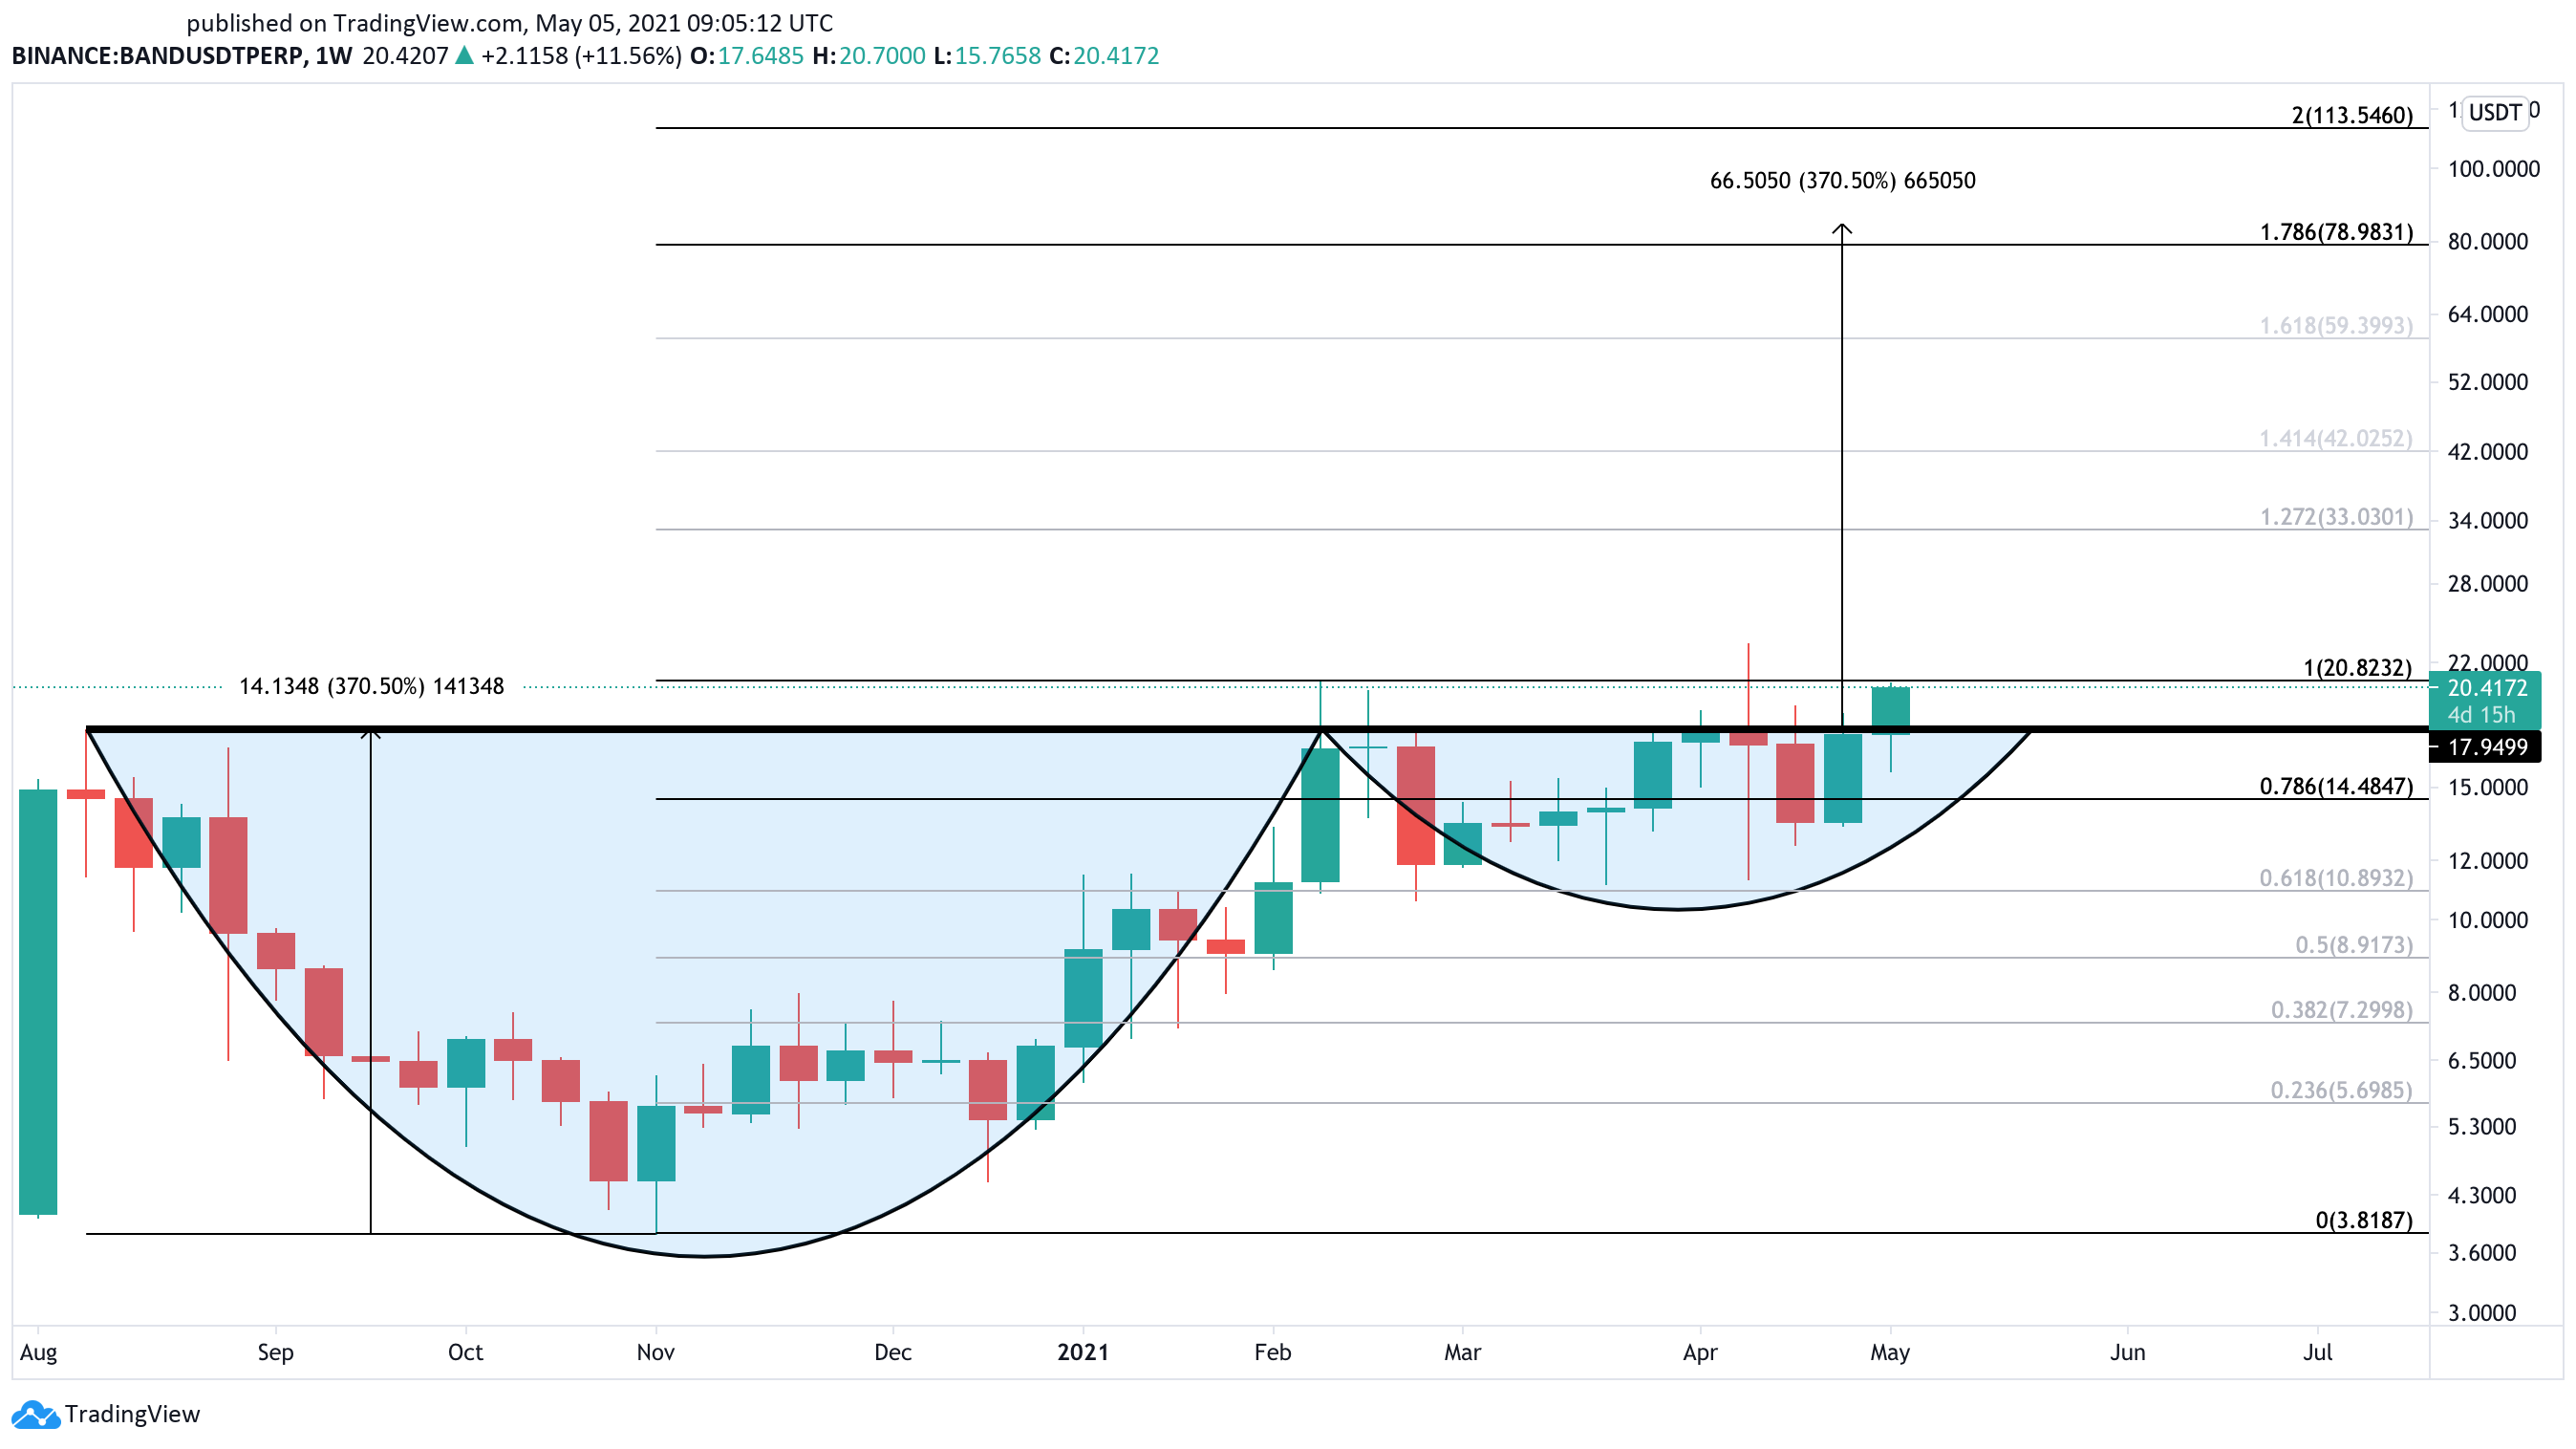
Such an optimistic target is determined by measuring the height between the bottom of the cup and the $20.80 barrier, then adding that distance upward from the breakout point.
Disclosure: At the time of writing, this author held Bitcoin and Ethereum.