Pundi X Price Analysis NPXS / USD: New Trading High
The pair is hitting new highs with a strongly bullish outlook.

Share this article
- Pundi X has a bullish short-term outlook, with the NPXS / USD pair advancing to a new 2019 trading high
- The four-hour time frame shows that bulls have successfully invalidated a bearish head and shoulders pattern
- The daily time frame is showing that a major bullish breakout is currently underway
Pundi X / USD Short-term price analysis
Pundi X has a bullish short-term outlook, with the cryptocurrency advancing to a fresh 2019 trading high.
The four-hour time frame shows that a head and shoulders pattern has been invalidated, with the NPXS / USD pair retracing back towards the head of the bearish pattern.
Technical indicators across the four-hour time frame are bullish and continue to generate buy signals.
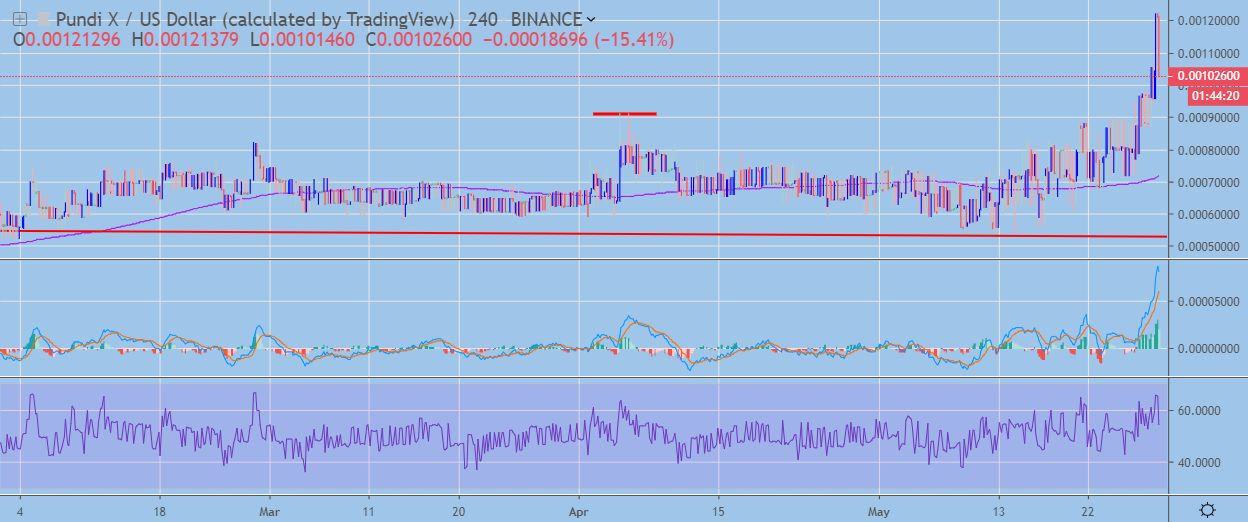 NPXS / USD H4 Chart by TradingView
Pattern Watch
Traders should note that despite the strong move higher, the NPXS / USD pair has yet to reach its full invalidation target on the four-hour time frame.
Relative Strength Index
The RSI indicator is bullish on the four-hour time frame, although it is now correcting from overbought conditions.
MACD Indicator
The MACD indicator is bullish on four-hour time frame, with the MACD signal line still generating a buy signal.
Pundi X / USD Medium-term price analysis
Pundi X has an increasingly bullish medium-term outlook, with the cryptocurrency continuing to break higher after successfully moving above its key 200-day moving average.
The daily time frame is showing that the large inverted head and shoulders pattern has finally been triggered, with the breakout upside move yet to reach its full upside target.
Technical indicators on the daily time frame are currently mixed as a minor technical correction is underway.
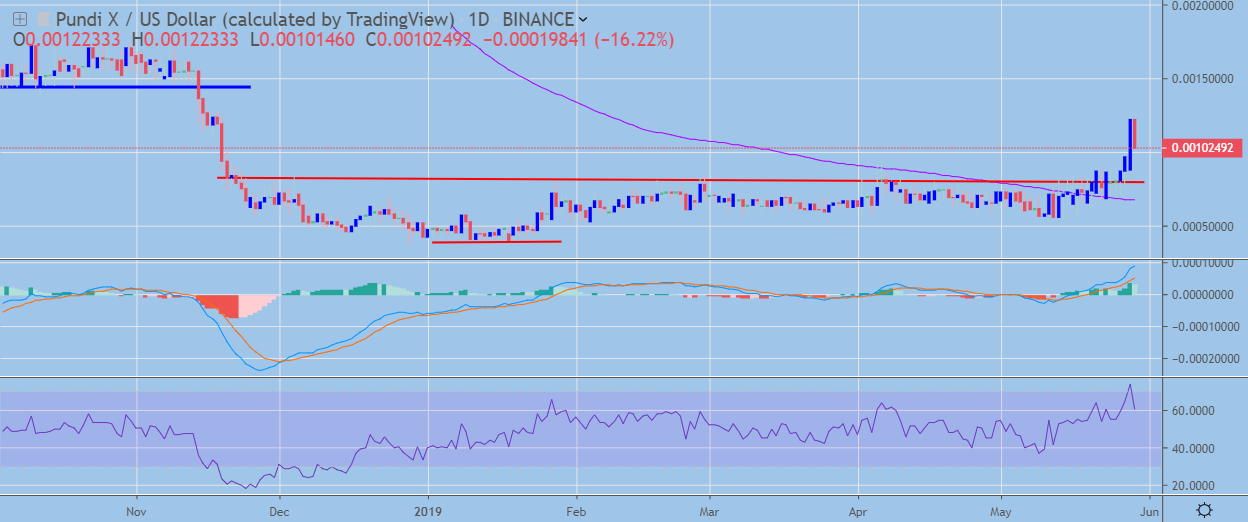 NPXS / USD Daily Chart by TradingView
Pattern Watch
Traders should note that the November 14th, 2018 trading high is the overall upside target of the inverted head and shoulders on the daily time frame.
Relative Strength Index
The RSI indicator is bullish on the daily time frame, although the indicator is turning lower due to a downward price correction.
MACD Indicator
The MACD indicator on the daily time frame is bullish, with the MACD signal line still issuing a buy signal.
Conclusion
Pundi X has finally performed a major technical breakout across both time horizons after spending much of 2019 consolidating below its 200-day moving average.
Further upside still appears possible for this cryptocurrency as the four-hour and daily time frames both suggest that the breakout move in the NPXS / USD pair is not yet completed.
Pundi X wants to make crypto payments simpler, find out how in our coin guide.
Share this article
