
Qtum Price Analysis QTUM / USD: Pattern Superposition
Multiple patterns highlight the indecisiveness of the coin.
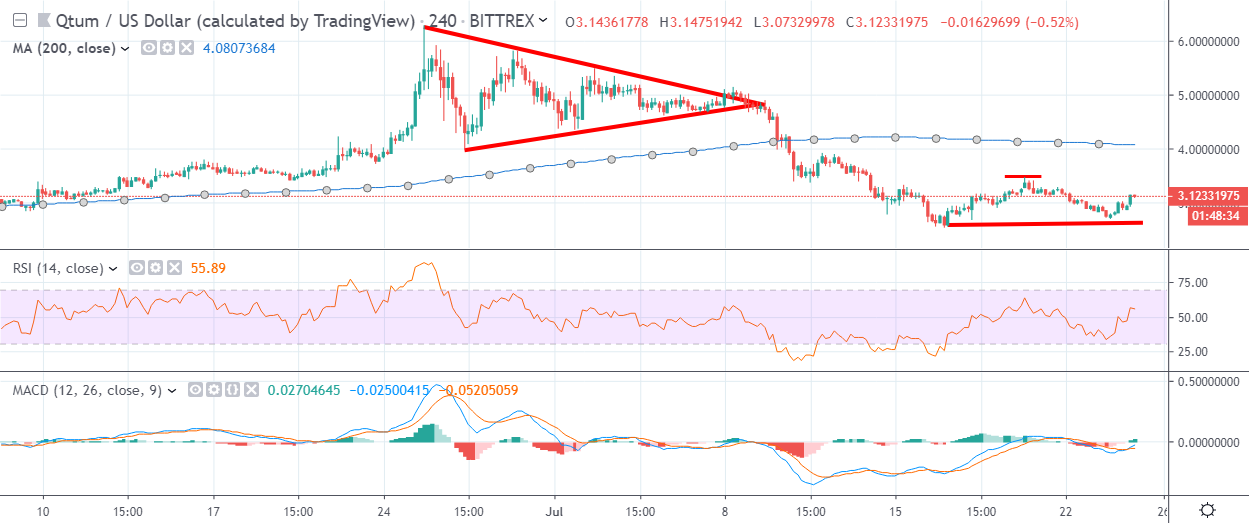
- QTUM has a bearish short-term bias, with the QTUM / USD pair still trading below its 200-period moving average
- The four-hour time frame shows that a bearish head and shoulders pattern has formed
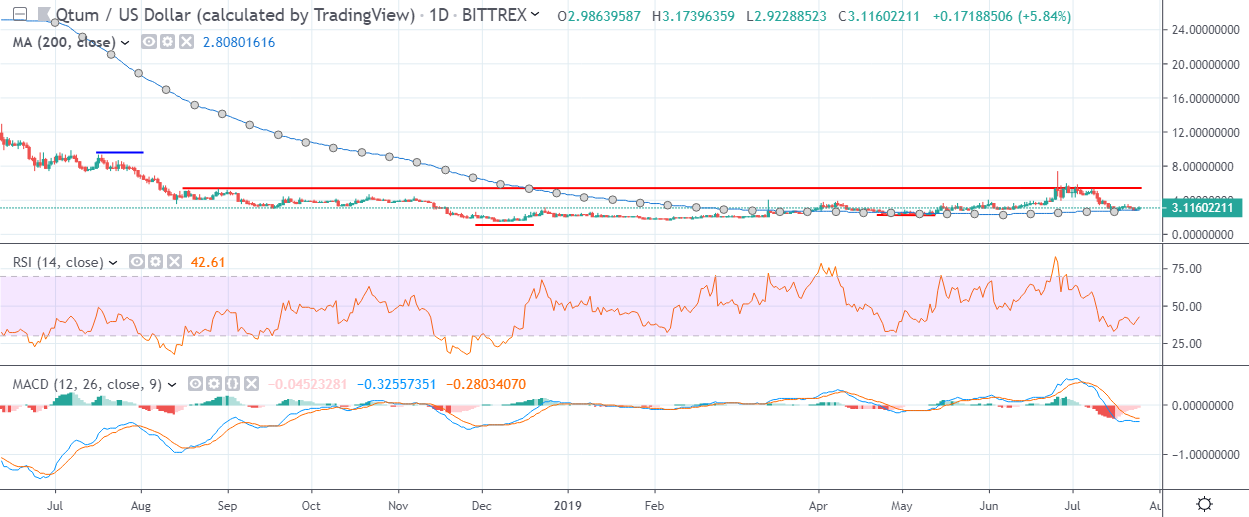
- The daily time frame continues to show a valid inverted head and shoulders pattern
QTUM / USD Short-term price analysis
QTUM has a bearish short-term trading bias, with the cryptocurrency still trading below its 200-period moving average on the four-hour time frame.
The four-hour time frame shows that a bearish head and shoulders pattern is starting to form, which could trigger the next bearish move lower in the QTUM / USD pair.
Technical indicators on the four-hour time frame have turned bullish and continue to generate buy signals.
Pattern Watch
Traders should note that a bullish double-bottom pattern is also in play across the four-hour time frame.
Relative Strength Index
The Relative Strength indicator has turned bullish on the four-hour time frame and is generating a buy signal.
MACD Indicator
The MACD indicator has turned bullish on the four-hour time frame, with the MACD signal and histogram both issuing a buy signal.
QTUM / USD Medium-term price analysis
QTUM has a neutral medium-term trading outlook, with the QTUM / USD pair probing towards its trend defining 200-day moving average.
The daily time frame is showing that the QTUM / USD pair is at a critical juncture over the medium-term, as bulls and bear battle around key technical support.
Technical indicators on the daily time frame are bearish and continue to generate sell signals.
Pattern Watch
Traders should note that the large inverted head and shoulders pattern still remains valid on the daily time frame.
Relative Strength Index
The Relative Strength indicator remains bearish on the daily time frame and continues to issue a sell signal.
MACD Indicator
The MACD indicator is bearish on the daily time frame and continues to generate a sell signal.
Conclusion
QTUM is at a critical juncture over both short and medium-term, as bulls and bears battle for directional control around the QTUM / USD pair’s 200-day moving average.
The four-hour time frame best illustrates the near-term struggle, with a head and shoulders pattern pitched against a double-bottom pattern.
Check out our coin guide for Qtum for a quick introduction to the project.