QTUM Price Analysis QTUM / USD: Global Rise
Qtum is building momentum towards a new trading high.

Share this article
- QTUM has a bullish short-term bias, with the QTUM / USD pair advancing to a fresh 2019 trading high
- The four-hour time frame shows that a bullish breakout is currently underway
- The daily time frame continues to show a valid inverted head and shoulders pattern
QTUM / USD Short-term price analysis
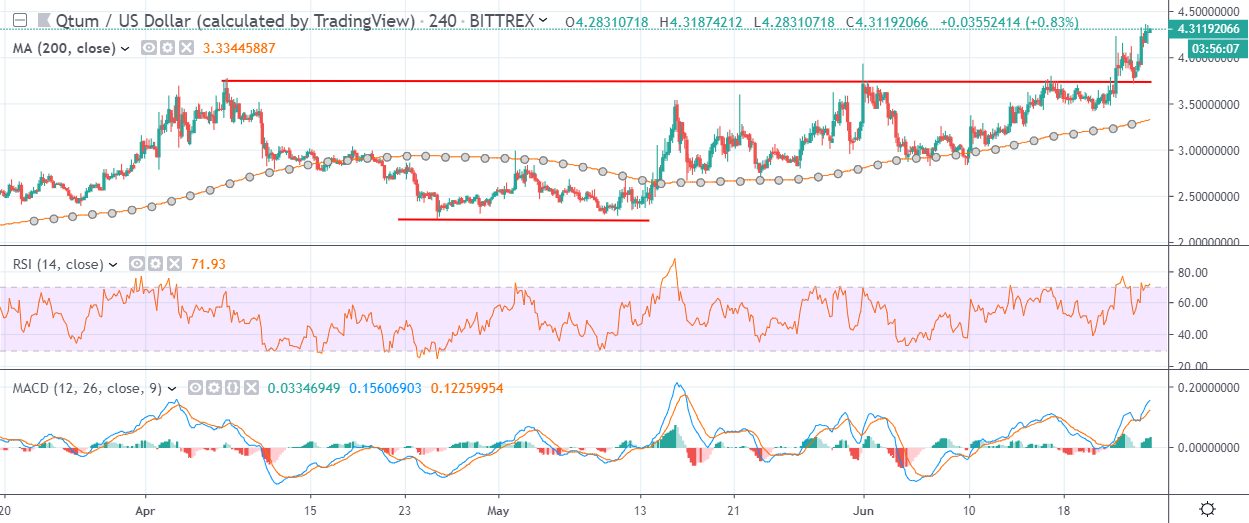
QTUM has a bullish short-term trading bias, with the cryptocurrency surging to a fresh 2019 trading high.
The four-hour time frame shows that a technical breakout is currently underway, with bulls triggering a large inverted head and shoulders pattern in action.
Technical indicators on the four-hour time frame have turned bullish and continue to generate a strong buy signal.

Pattern Watch
Traders should note that the November 2018 trading high is the overall upside target of the inverted head and shoulders pattern on the four-hour time frame.
Relative Strength Index
The Relative Strength Indicator is bullish on the four-hour time frame and is still generating a buy signal.
MACD Indicator
The MACD indicator has turned bullish on the four-hour time frame, with the MACD signal and histogram both issuing buy signals.
QTUM / USD Medium-term price analysis
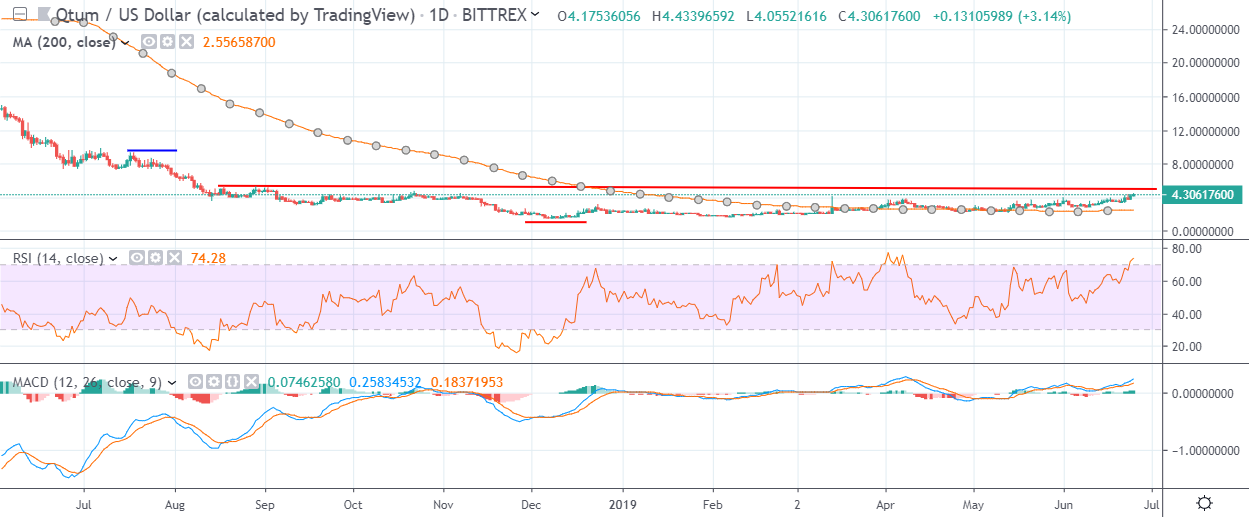
QTUM has a bullish medium-term trading outlook, with the QTUM / USD pair advancing towards critical technical resistance on the daily time frame.
The daily time frame is showing that an extremely large inverted head and shoulders pattern remains in play, with buyers so far unable to ignite the bullish pattern.
Technical indicators on the daily time frame are bullish and continues to generate a buy trading signal.

Pattern Watch
Traders should note that the July 2018 trading high is the overall bullish target of the large inverted head and shoulders pattern on the daily time frame.
Relative Strength Index
The Relative Strength indicator is bullish and continues to issue a buy signal on the daily time frame.
MACD Indicator
The MACD indicator is bullish on the daily time frame and continues to generate strong buy signal.
Conclusion
QTUM is undergoing a strong upside technical breakout in short-term horizon, with the move higher yet to reach its full upside potential.
Buyers now need to trigger the bullish inverted head and shoulders pattern on the daily time frame to further secure the QTUM / USD pair’s medium-term outlook.
Check out our coin guide for Qtum for a quick introduction to the project.
Share this article
