 Earn with Nexo

QTUM Price Analysis QTUM / USD: Space To Move Either Way
Qtum has contrasting patterns between short and medium-term.
- QTUM has a bullish short-term bias, with the QTUM / USD pair now trading above its 200-period moving average on the four-hour time frame
- The four-hour time frame now shows a bearish head and shoulders pattern
- The daily time frame shows a large inverted head and shoulders pattern
QTUM / USD Short-term price analysis
QTUM has a bullish short-term trading bias, with the cryptocurrency recovering above its 200-period moving average on the four-hour time frame.
The four-hour time frame shows that a large head and shoulders pattern has formed, with QTUM / USD bulls needing to rally the cryptocurrency towards the best levels of 2019 to invalidate the bearish pattern.
Technical indicators on the four-hour time frame have turned bullish and continue to generate a strong buy signal.
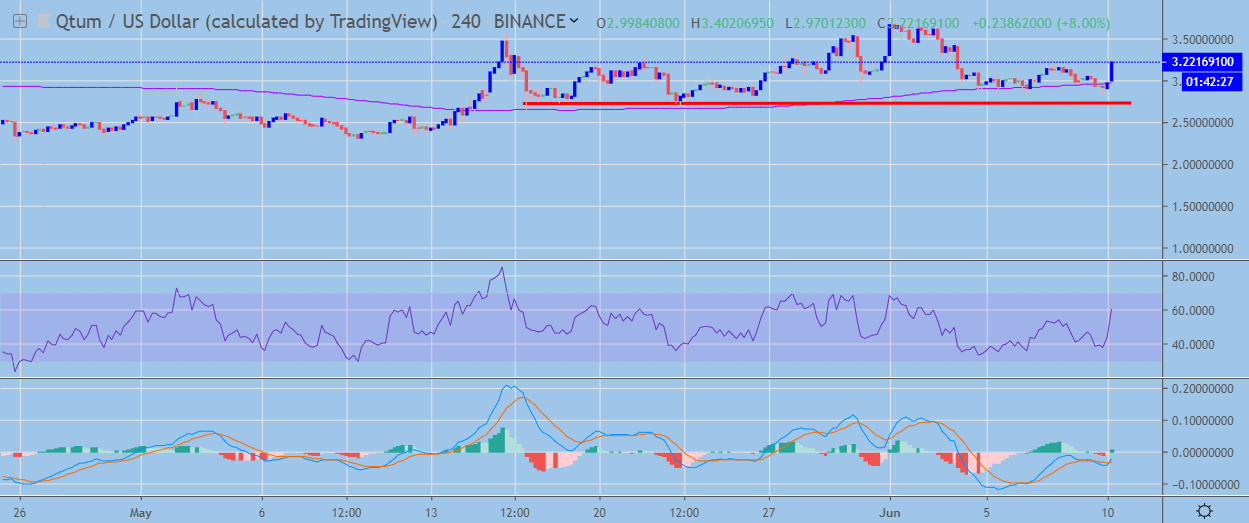 QTUM / USD H4 Chart by TradingView
Pattern Watch
Traders should note that a complex head and shoulders pattern could be forming on the four-hour time frame, with multiple right-hand shoulders.
Relative Strength Index
The Relative Strength Index is bullish on the four-hour time frame and is currently generating a strong buy signal.
MACD Indicator
The MACD indicator has turned bullish on the four-hour time frame, with the MACD signal line now issuing a buy signal.
QTUM / USD Medium-term price analysis
QTUM has a bullish medium-term trading bias, with the QTUM / USD pair holding price well above its key 200-day period moving average.
The daily time frame is showing that a large inverted head and shoulders pattern has now formed, with buyers now needing to rally price above the April 2019 trading high to ignite the bullish pattern.
Technical indicators on the daily time frame are currently mixed and are failing to generate a clear trading signal.
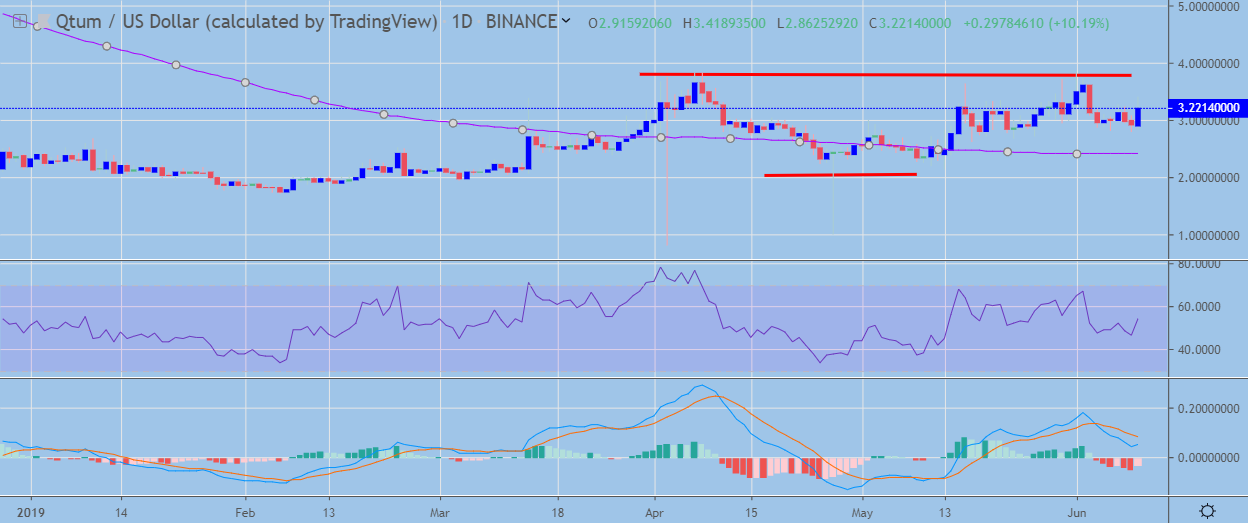 QTUM / USD Daily Chart by TradingView
Pattern Watch
Traders should note that the August 2018 trading high is the bullish target of the large inverted head and shoulders pattern on the daily time frame.
Relative Strength Index
The Relative Strength indicator is neutral and is failing to provide a clear trading signal on the daily time frame.
MACD Indicator
The MACD indicator has a slight downward bias on the daily time frame, with the MACD signal line still crossing lower.
Conclusion
QTUM bulls are currently working hard to invalidate the bearish pattern on the four-hour time frame, which has taken shape due to the sharp downward correction earlier this month.
The medium-term outlook still looks bright for the QTUM / USD pair, with the bullish pattern on the daily pattern eluding to further strong medium-term gains for the cryptocurrency.
Check out our coin guide for Qtum for a quick introduction to the project.