 Earn with Nexo

Ren Price Analysis REN / BTC: Potential Rise
REN has significant potential over BTC.
- Ren has a bullish short-term bias against Bitcoin, with the cryptocurrency trading well above its 200-period moving average on the four-hour time frame
- The four-hour time frame shows that bulls are working hard to invalidate a bearish head and shoulders pattern
- The daily time frame continues to show that a major technical breakout is underway
Ren / Bitcoin Short-term price analysis
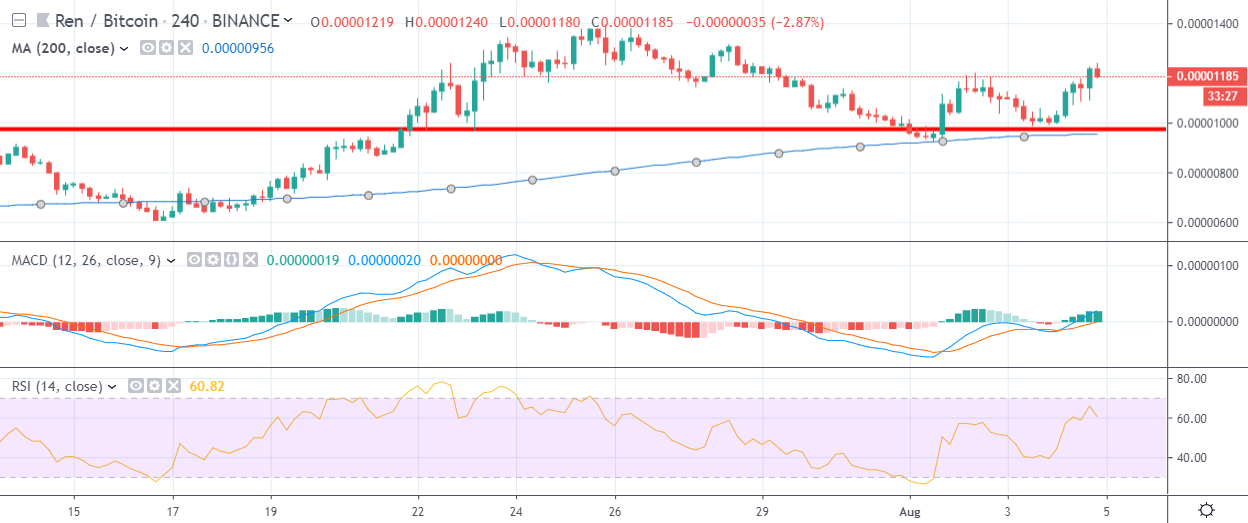
Ren has a bullish short-term trading bias against Bitcoin, with the REN / BTC pair bouncing from its 200-period moving average on the four-hour time frame.
The four-hour time frame shows that REN / BTC bulls are working hard to invalidate a bearish head and shoulders pattern and trigger the next upside breakout.
Technical indicators across the four-hour time horizon are bullish and continue to issue a buy signal.
Pattern Watch
Traders should note that the REN / BTC pair could fall sharply if price falls below the neckline of the bearish head and shoulders pattern.
Relative Strength Index
The Relative Strength Index on the four-hour time frame is bullish, although it is starting to correct from overbought conditions.
MACD Indicator
The MACD indicator on the four-hour time frame is bullish and continues to generate a buy signal.
Ren / Bitcoin Medium-term price analysis
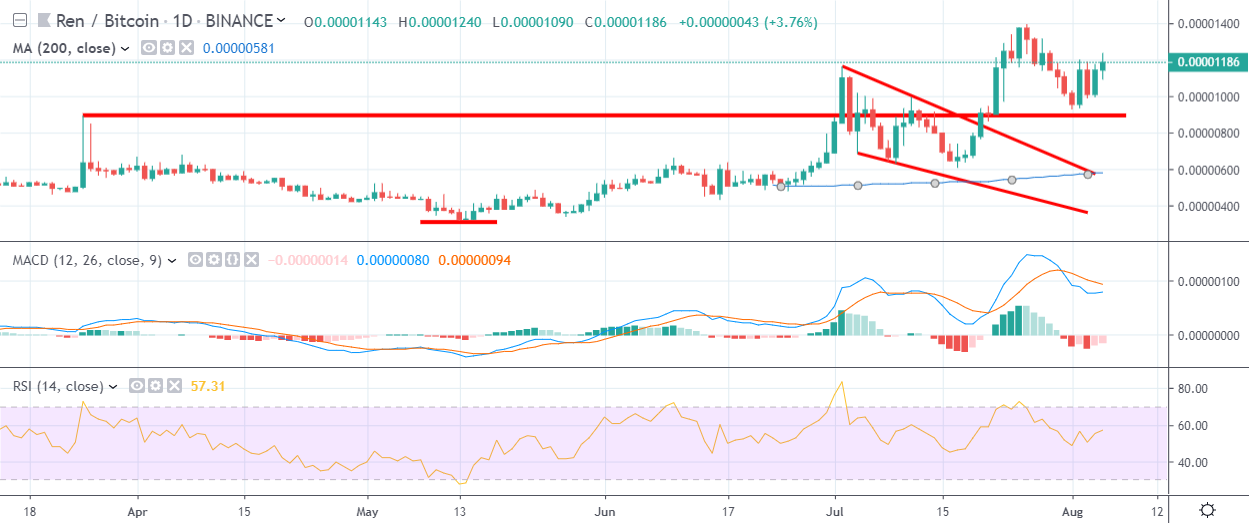
Ren has a bullish medium-term outlook against Bitcoin, with the REN / BTC pair bouncing sharply from key technical support on the daily time frame.
The daily time frame shows a strong technical breakout is currently underway, with the REN / BTC trading above the neckline of large inverted head and pattern.
Technical indicators on the daily time frame are conflicted and are failing to generate a clear trading signal.
Pattern Watch
Traders should note that the overall upside projection of the bullish inverted head and shoulders pattern would take the REN / BTC pair to a new all-time trading high.
Relative Strength Index
The RSI indicator is bullish on the daily time frame and shows scope for further upside.
MACD Indicator
The MACD indicator is conflicted on the daily time frame and is currently failing to generate a clear trading signal.
Conclusion
Ren is attempting to regain bullish momentum on the four-hour chart, with REN / BTC buyers now needing to invalidate a bearish head and shoulders pattern.
Large bullish pattern on the daily time frame still suggests that the cryptocurrency has substantial upside potential against Bitcoin over the medium-term.