
RIF Token Price Analysis RIF / USD: Bulls Take Control
RIF has a great upside potential.

Share this article
- RIF Token has a bullish short and medium-term trading bias
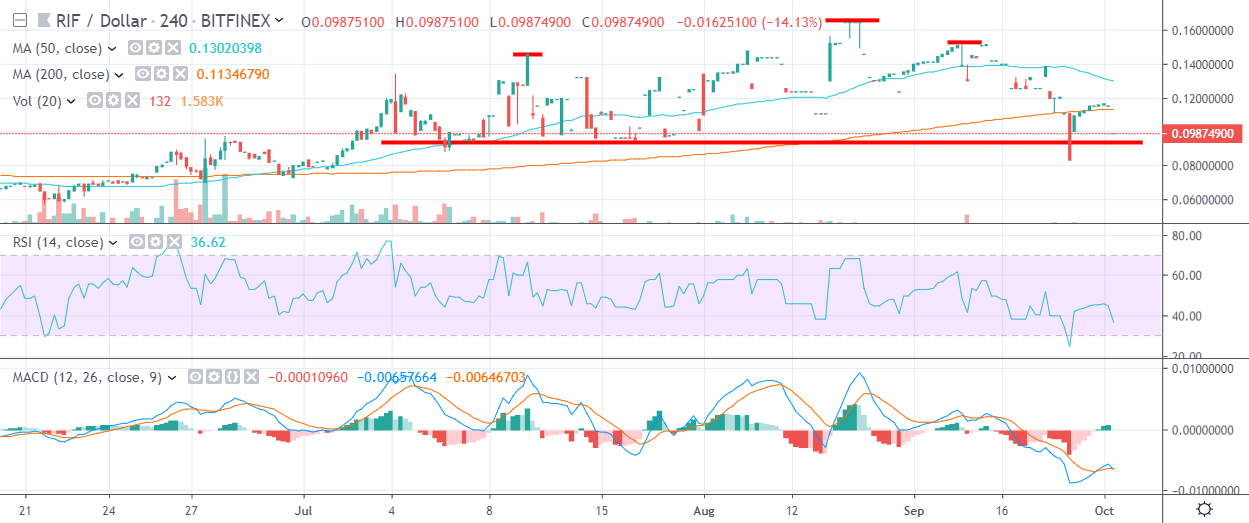
- The four-hour time frame shows that a bearish head and shoulders pattern has formed
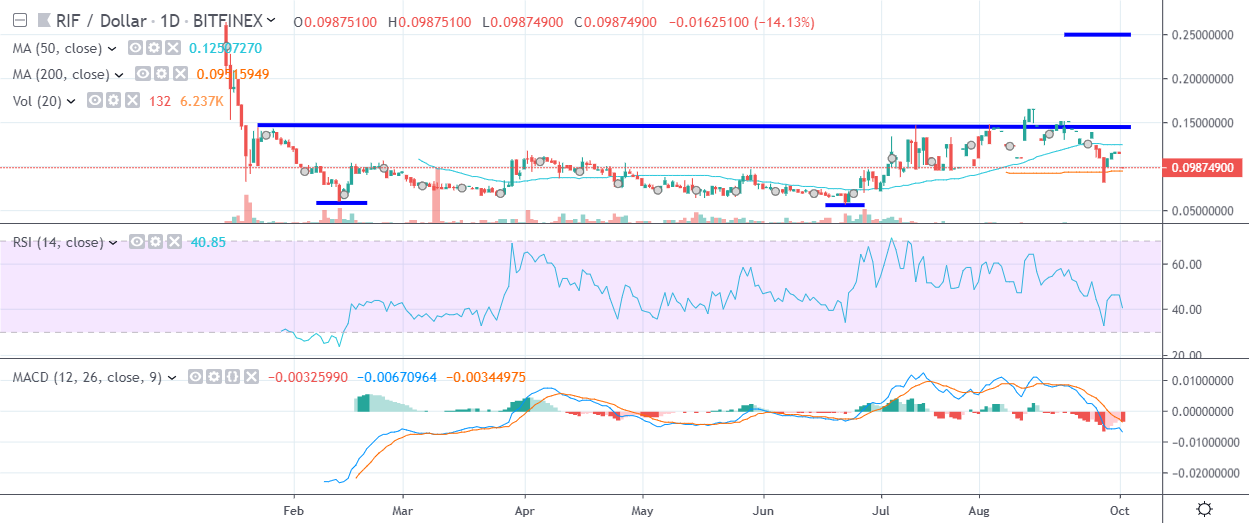
- The daily time frame shows a huge inverted head and shoulders pattern that could propel the cryptocurrency back towards its all-time price high.
With many digital assets recently turning technically bearish and remaining under downside pressure, RIF Token, which focuses on bringing smart contracts to the Bitcoin blockchain, shows strong near-term upside potential over the medium-term and is also holding firm above its key short-term moving averages.
The cryptocurrency recently broke above its long-term trading range that had remained in place since late-January this year. Furthermore, the recent rally helped to form a bullish pattern across the daily time frame with a strong upside projection.
The upside projection of the bullish inverted head and shoulders pattern on the daily time frame would take the RIF / USD pair back towards its all-time price high if fully ignited.
Bulls need to rally the cryptocurrency back above the neckline of the bullish pattern to encourage buyers to move the RIF / USD pair towards levels not seen since mid-January this year.
Encouragingly, the RIF / USD pair is trading above its 200-period moving average on the four-hour time frame, which shows that short-term bulls are still in control.
The main obstacle buyers face at present is a potential head and shoulders pattern forming on the four-hour time frame. Bulls need to move price above the August and September monthly trading highs to negate the bearish pattern.
According to the latest sentiment data from TheTIE.io, the short-term sentiment towards RIF is neutral, at 47.00 %, while the overall long-term sentiment towards the cryptocurrency is also neutral, at 50.00%.
Upside Potential
The four-hour time frame highlights that the RIF / USD pair must rally to new multi-month trading highs to encourage bulls to force a sustainable technical breakout.
The daily time frame shows a large inverted head and shoulders pattern, with the upside projection of the bullish pattern located close to the RIF / USD pair’s current all-time trading high.
Downside Potential
The four-hour time frame is showing a bearish head and shoulders pattern, which if fully ignited could force the RIF / USD pair back towards its current all-time price low.

The cryptocurrency’s 200-period moving average on the four-hour time frame is the key support bears need to break, while the July trading low is another key bearish breakout area traders need to watch.
Summary
RIF Token has significant upside potential over the medium-term if bulls can ignite an extremely large inverted head and shoulders pattern on the daily time frame.
The RIF / USD pair still faces challenges in the near-term, with buyers needing to rally the cryptocurrency above its former monthly trading high to negate a bearish pattern on the four-hour time frame.
RIF has been examined in detail by our SIMETRI Research team.
Share this article
