Steem / USD Technical Analysis: Bleak Prospects
Steem is losing buying pressure as it falls below its moving averages on the four hour and daily charts.

Share this article
- STEEM has a bearish short-term outlook, with the cryptocurrency trading below its 200-period moving average on the four-hour time frame
- The four-hour time frame is also showing a bearish double-top pattern formation
- STEEM / USD has a bearish medium-term outlook, with price now trading under the pair’s key 200-day moving average
Steem / USD Short-term price analysis
STEEM has a bearish short-term outlook, with the price now trading below the STEEM / USD pair’s 200-period moving average on the four-hour time frame.
The four-hour time frame is showing that a bearish double-top pattern formation is creating technical selling pressure, with price making bearish lower lows and lower highs.
Technical indicators on the four-hour time frame have also turned bearish following the latest decline.
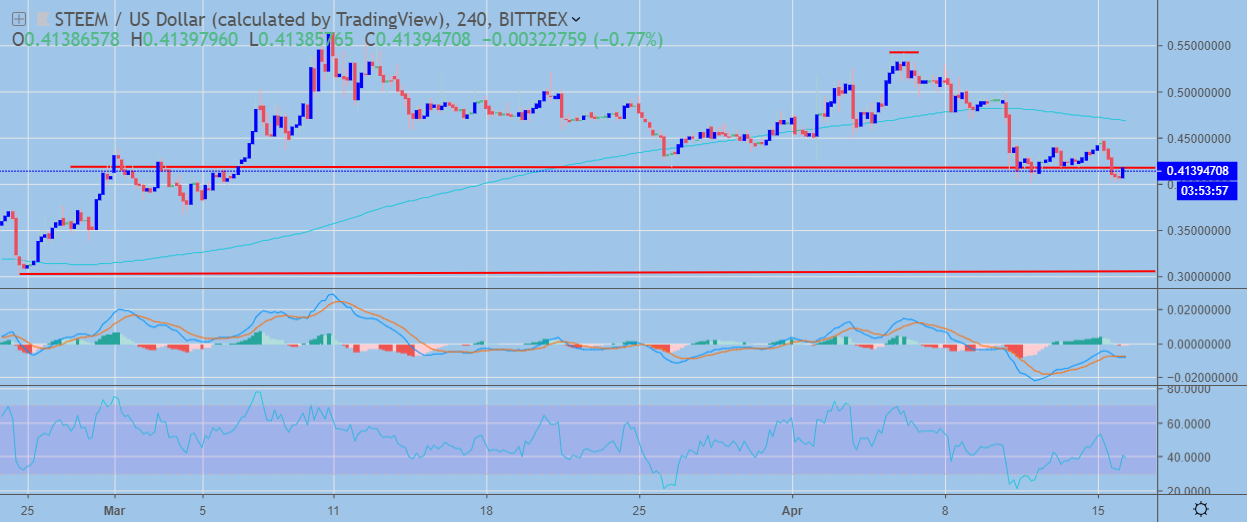 STEEM / USD H4 Chart by TradingView
Pattern Watch
Traders should note that the February 24th swing-low is the likely bearish target of the double-bottom pattern.
Relative Strength Index
The RSI indicator on the four-hour time frame has turned bearish after falling below neutral.
MACD Indicator
The MACD indicator on the four-hour time frame has turned bearish.
Steem / USD Medium-term price analysis
Steem has a bearish medium-term outlook, with price now trading back under the STEEM / USD pair’s trend defining 200-day moving average.
The daily time frame is showing that the STEEM / USD pair is now trading back inside the descending price channel, after a false upside breakout above the price channel.
Technical indicators on the daily time frame have now turned bearish and continue to signal further medium-term losses.
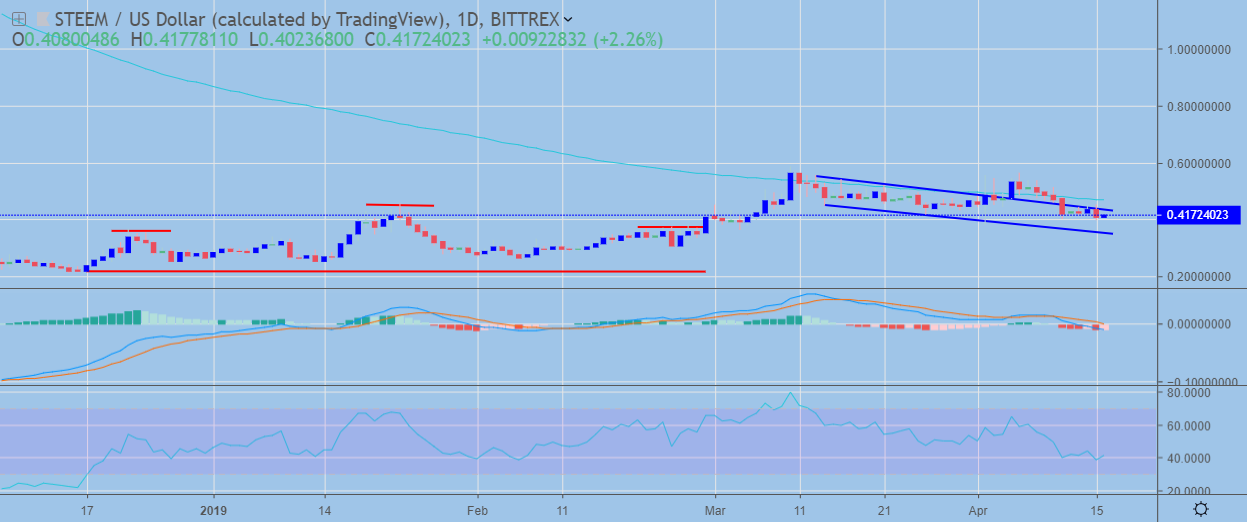 STEEM / USD Daily Chart by TradingView
Pattern Watch
Traders should note that a bearish head and shoulders pattern could start to take shape on the daily time frame.
Relative Strength Index
The Relative Strength Indicator on the daily time frame has turned bearish as downside pressures increase.
MACD Indicator
The MACD indicator on the daily time frame has turned bearish, with both the MACD signal line and histogram trending lower.
Conclusion
STEEM is coming under pressure in the near-term, with the recently created bearish double-top pattern formation weighing on the pair.
The medium-term prospects for the STEEM / USD pair are also coming into question, with price now trading below its key 200-day moving average. Traders should closely monitor the daily time frame for a potential bearish head and shoulders pattern.
Check out our coin guide for Steem to get a quick overview of the project.
For a deeper dive into the investment grade of the project, head over to our recent DARE report.
Share this article
