 Earn with Nexo

STEEM / USD Price Analysis: Running Low On Energy
Steem has turned bearish on all time frames despite the market rally.
- Steem has a bearish short-term outlook, with the STEEM / USD pair still under near-term pressure
- Steem has a bearish medium-term outlook, with the cryptocurrency trading at its weakest level since late February
- The daily time frame continues to show a large bearish head and shoulders pattern.
Steem / USD Short-term price analysis
Steem has a bearish short-term outlook, with the cryptocurrency still trading well below its 200-period moving average on the four-time frame.
The four-hour time frame is showing that a bearish head and shoulders pattern is taking shape, with traders currently selling any upside rallies in the STEEM / USD pair.
Technical indicators on the four-hour time frame are bearish and show scope for further downside.
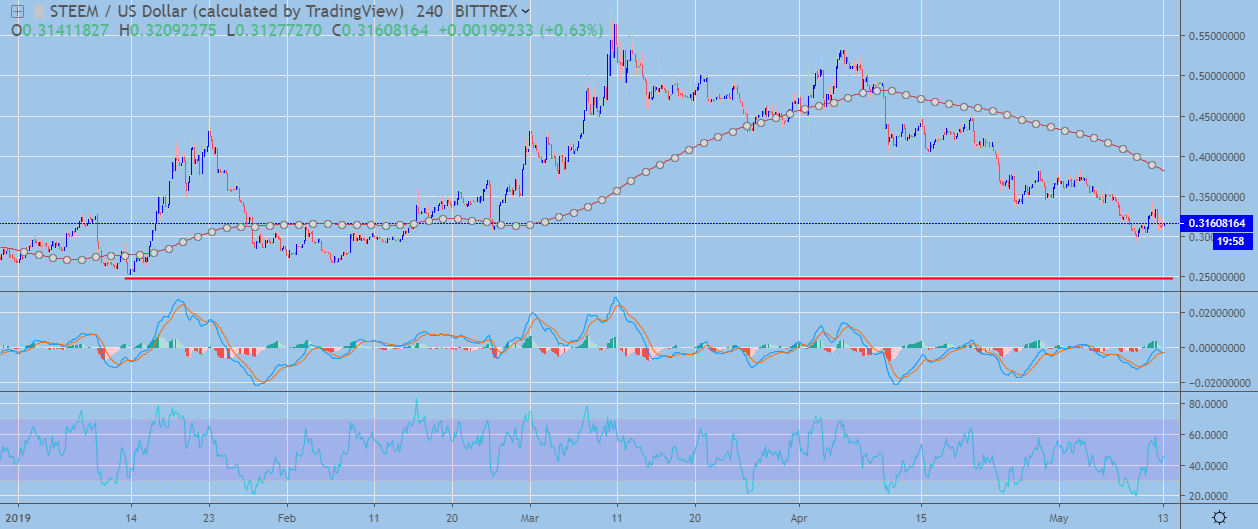 STEEM / USD H4 Chart by TradingView
Pattern Watch
Traders should note the December 2018 trading low offers the strongest form of technical support on the four-hour time frame.
Relative Strength Index
The RSI indicator on the four-hour time frame is bearish, with the indicator showing scope for further downside.
MACD Indicator
The MACD indicator on the four-hour time frame has turned bearish and is generating a sell signal.
Steem / USD Medium-term price analysis
Steem has a bearish medium-term outlook, with the cryptocurrency under selling pressure below its trend defining 200-day moving average.
The daily time frame is showing a large head and shoulders pattern, with the STEEM / USD pair trading ever close to the neckline of the bearish pattern.
Technical indicators on the daily time frame remain bearish and highlight that medium-term sellers are still firmly in control.
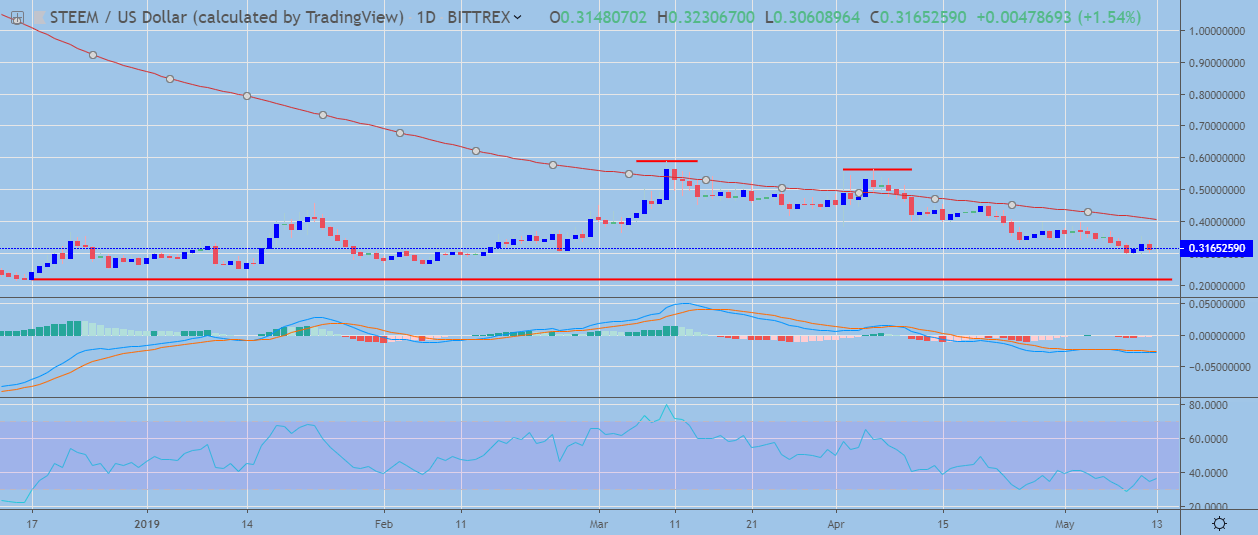 STEEM / USD Daily Chart by TradingView
Pattern Watch
Traders should note that a complex head and shoulders pattern could start to form on the daily time frame.
Relative Strength Index
The Relative Strength indicator on the daily time is bearish and highlights ongoing the medium-term weakness in the STEEM / USD pair.
MACD Indicator
The MACD indicator on the daily time remains bearish and shows scope for further downside.
Conclusion
Steem has an increasingly bearish outlook over both time frames, with the STEEM / USD pair being sold sharply lower on any upside rallies.
The bearish pattern on the daily time frame points to further medium-term downside, with the cryptocurrency at risk of falling to a new all-time trading low.
For an introduction to the Steemit platform and its token, check out our coin guide.
If you need a deeper analysis of the fundamentals, we recently released our DARE for Steem.