Steem / USD Technical Analysis: Losing Bearish Pressure

Share this article
- Steem is bearish in the short-term, although indicators are showing signs of possible downside exhaustion
- Medium-term outlook for Steem is heavily bearish with further losses likely
- A large head and shoulders pattern has formed across the four-hour and daily time frame
Steem / USD Short-term price analysis
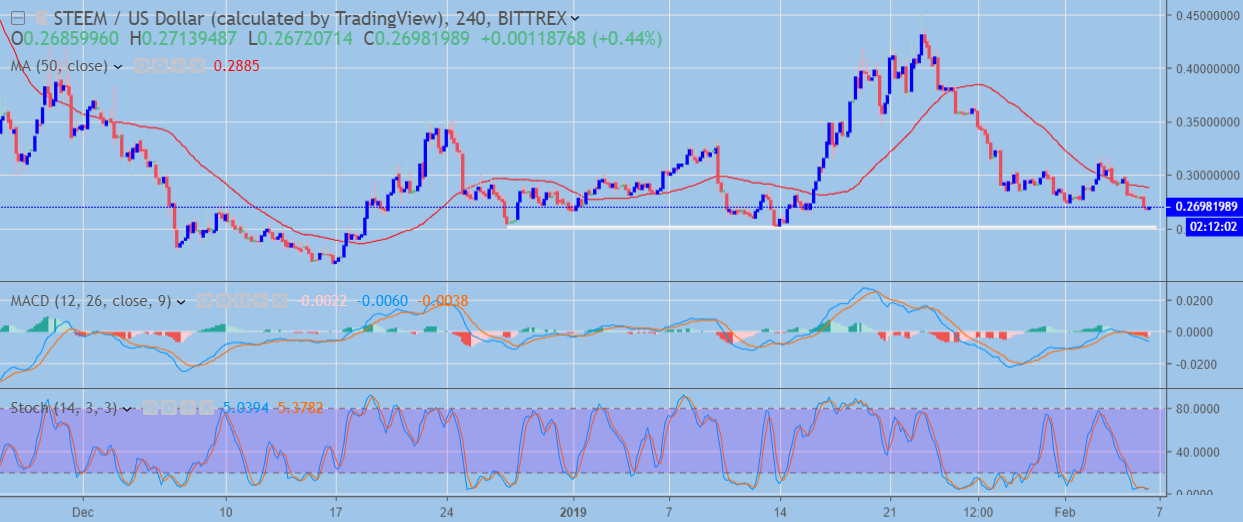
In the short-term, Steem is bearish and is rapidly approaching the neckline of a sizeable head and shoulders pattern. A break below the neckline of the bearish head and shoulders pattern should provoke a technical test of the pair’s 2018 trading low.
Technical indicators on the reliable four-hour time frame are starting to appear overstretched, which may provide an indication that the current move lower is starting to lose momentum.
Pattern Watch
The head and shoulders pattern on the four-hour time frame is a bearish development for Steem over the short-term, and should be watch carefully.

Steem / USD H4 Chart (Source: TradingView)
MACD Indicator
The MACD indicator is attempting to correct higher on the four-hour time frame and is currently providing no clear trading signal.
Stochastic Indicator
The Stochastic indicator has moved into oversold territory and provides another indication that the down move may be losing bearish momentum.
Steem / USD Medium-term price analysis
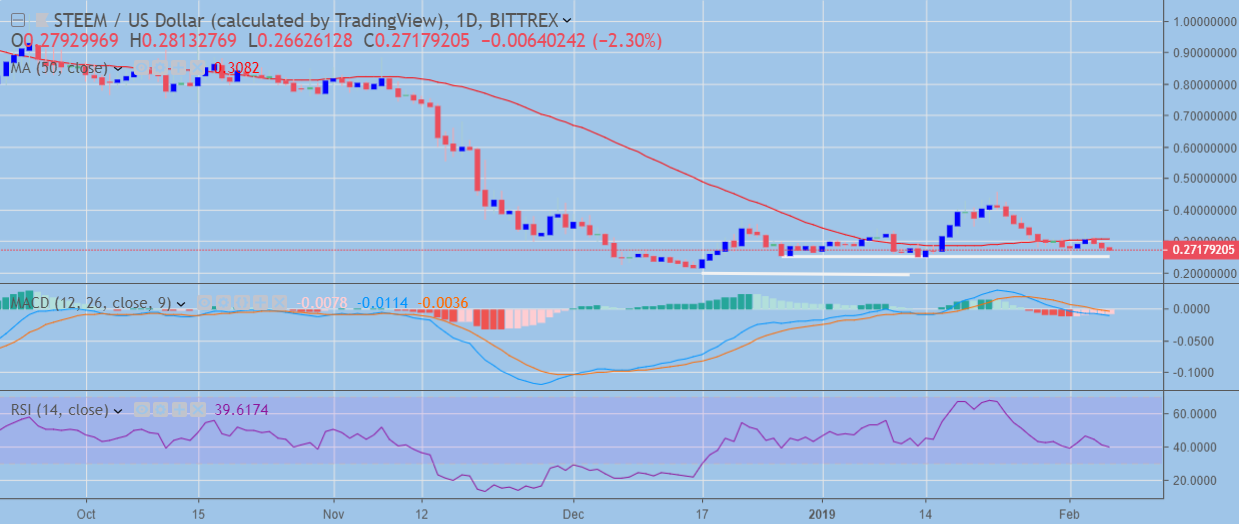
Steem is bearish in the medium-term and is showing signs that another downside breakout may soon occur as a large head and shoulders pattern appears to be taking shape on the daily time frame.
Since May of last year, the Steem / USD pair has had a brief period of price consolidation, followed by sharp moves lower.
Daily time frame indicators are signaling that the Steem / USD pair has yet to reach oversold territory, which conflicts with technical indicators on the four-hour time frame.
Pattern Watch
Traders should watch for a sustained bearish break below the neckline of the head and shoulders pattern. Caution is warranted though, as the pair could still make a sharp countermove and form a larger left-side shoulder.

Steem / USD Daily Chart (Source: TradingView)
MACD Indicator
The Momentum indicator on the daily time frame is starting to move lower, while the MACD signal line has also performed a bearish crossover.
RSI Indicator
The Relative Strength Indicator on the mentioned time frame is turning lower and has yet to reach oversold trading conditions.
Conclusion
Steem is bearish in the short and medium-term, although warning signs are emerging that the recent decline is losing bearish momentum. Traders should ultimately watch for a sustained break below the neckline of the head and shoulders pattern on the daily time frame for a more reliable bearish trading signal.
Decentral Media, Inc., the publisher of Crypto Briefing, is not an investment advisor and does not offer or provide investment advice or other financial advice. Nothing on this website constitutes, or should be relied on as, investment advice or financial advice of any kind. Specifically, none of the information on this website constitutes, or should be relied on as, a suggestion, offer, or other solicitation to engage in, or refrain from engaging in, any purchase, sale, or any other any investment-related activity with respect to any transaction. You should never make an investment decision on an investment based solely on the information on our website, and you should never interpret or otherwise rely on any of the information on this website as investment advice. We strongly recommend that you consult a licensed investment advisor or other qualified financial professional if you are seeking investment advice on an investment.
Share this article
