Steem / USD Technical Analysis: Struggling Against The Pattern

Share this article
- Steem is bullish in the short-term, although the MACD indicator is showing bearish divergence on the four-hour time frame
- The medium-term outlook for the cryptocurrency remains bearish despite the recent rally
- Bulls have much work to do to invalidate the bearish head and shoulders pattern on the daily time frame
Steem / USD Short-term price analysis
In the short-term, Steem is bullish after the recent rally in the cryptocurrency triggered a large inverted head and shoulders pattern on the four-hour time frame.
The MACD indicator on the four-hour time frame is showing bearish MACD divergence, which if corrected, would see the STEEM / USD pair falling back under its 200-period moving average on the mentioned time frame.
A downward correction may be nearing as technical indicators are starting to appear overstretched.
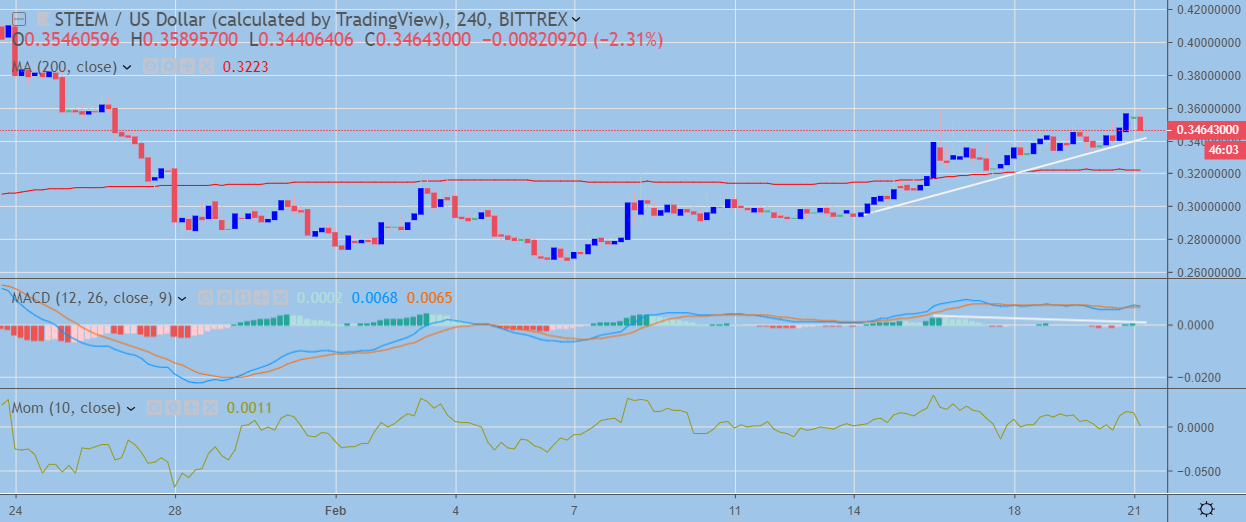
STEEM / USD H4 Chart (Source: TradingView)
Pattern Watch
A degree of caution is warranted as the bullish inverted head and shoulders pattern on the four-hour time frame has yet to reach its upside objective.
MACD Indicator
The MACD indicator is currently showing bearish MACD divergence on the four-hour time frame.
Momentum Indicator
The Momentum indicator is turning lower as the recent up move is starting to weaken.
Steem / USD Medium-term price analysis
Steem is bearish in the medium-term, with the recent up move failing to invalidate the large head and shoulders pattern across the daily time frame.
The cryptocurrency is trading well below its 200-day moving average; buyers will need to make significant gains to start to trade back above it. Technical indicators are also starting to approach overbought conditions on the daily time frame.
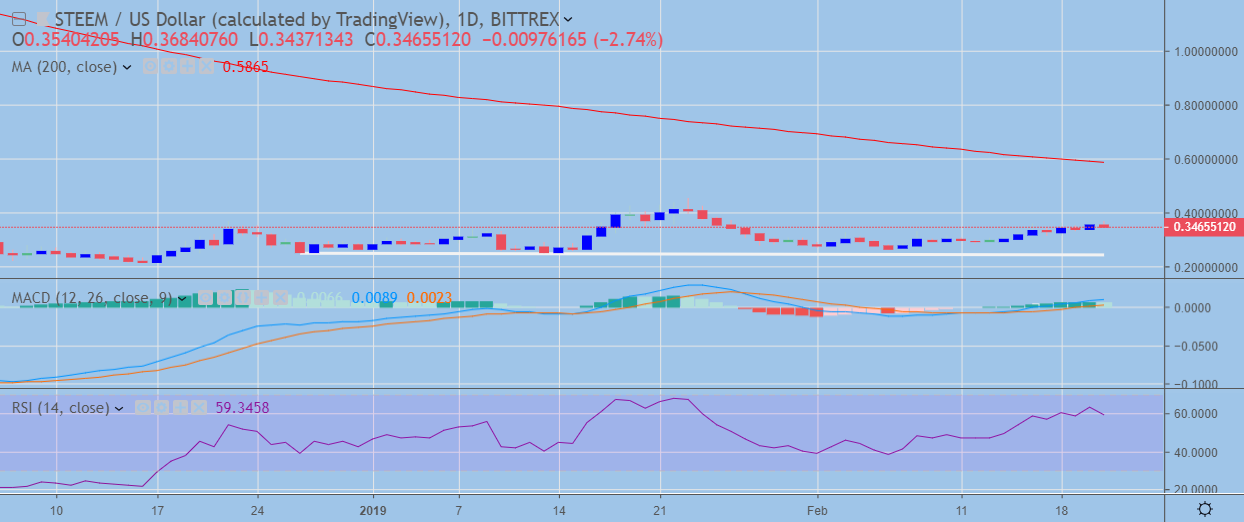
STEEM / USD Daily Chart (Source: TradingView)
Pattern Watch
Traders should watch the head and shoulders pattern for the potential creation of a right-hand shoulder or eventual invalidation of the bearish pattern.
MACD Indicator
The Momentum indicator on the daily time is still rising with a bullish crossover underway.
RSI Indicator
The Relative Strength Indicator on the mentioned time frame is turning lower after reaching overbought trading conditions.
Conclusion
Steem is bullish in the short-term, although the four-hour time frame is signaling that the latest up move has created large amounts of bearish price divergence. STEEM / USD medium-term outlook is likely to remain bearish until we see the cryptocurrency breaking to fresh 2019 trading highs and invalidating the head and shoulders pattern on the daily time frame.
Decentral Media, Inc., the publisher of Crypto Briefing, is not an investment advisor and does not offer or provide investment advice or other financial advice. Nothing on this website constitutes, or should be relied on as, investment advice or financial advice of any kind. Specifically, none of the information on this website constitutes, or should be relied on as, a suggestion, offer, or other solicitation to engage in, or refrain from engaging in, any purchase, sale, or any other any investment-related activity with respect to any transaction. You should never make an investment decision on an investment based solely on the information on our website, and you should never interpret or otherwise rely on any of the information on this website as investment advice. We strongly recommend that you consult a licensed investment advisor or other qualified financial professional if you are seeking investment advice on an investment
Share this article
