
Sell Signals Abound as Stellar Lumens Prepares 20% Correction
Stellar sits on shaky ground as several sell signals have emerged.
Stellar has been trading flat since its price skyrocketed by more than 190% in mid-November. Now, technicals suggest a steep 20% correction is underway.
Stellar Bound for Bearish Impulse
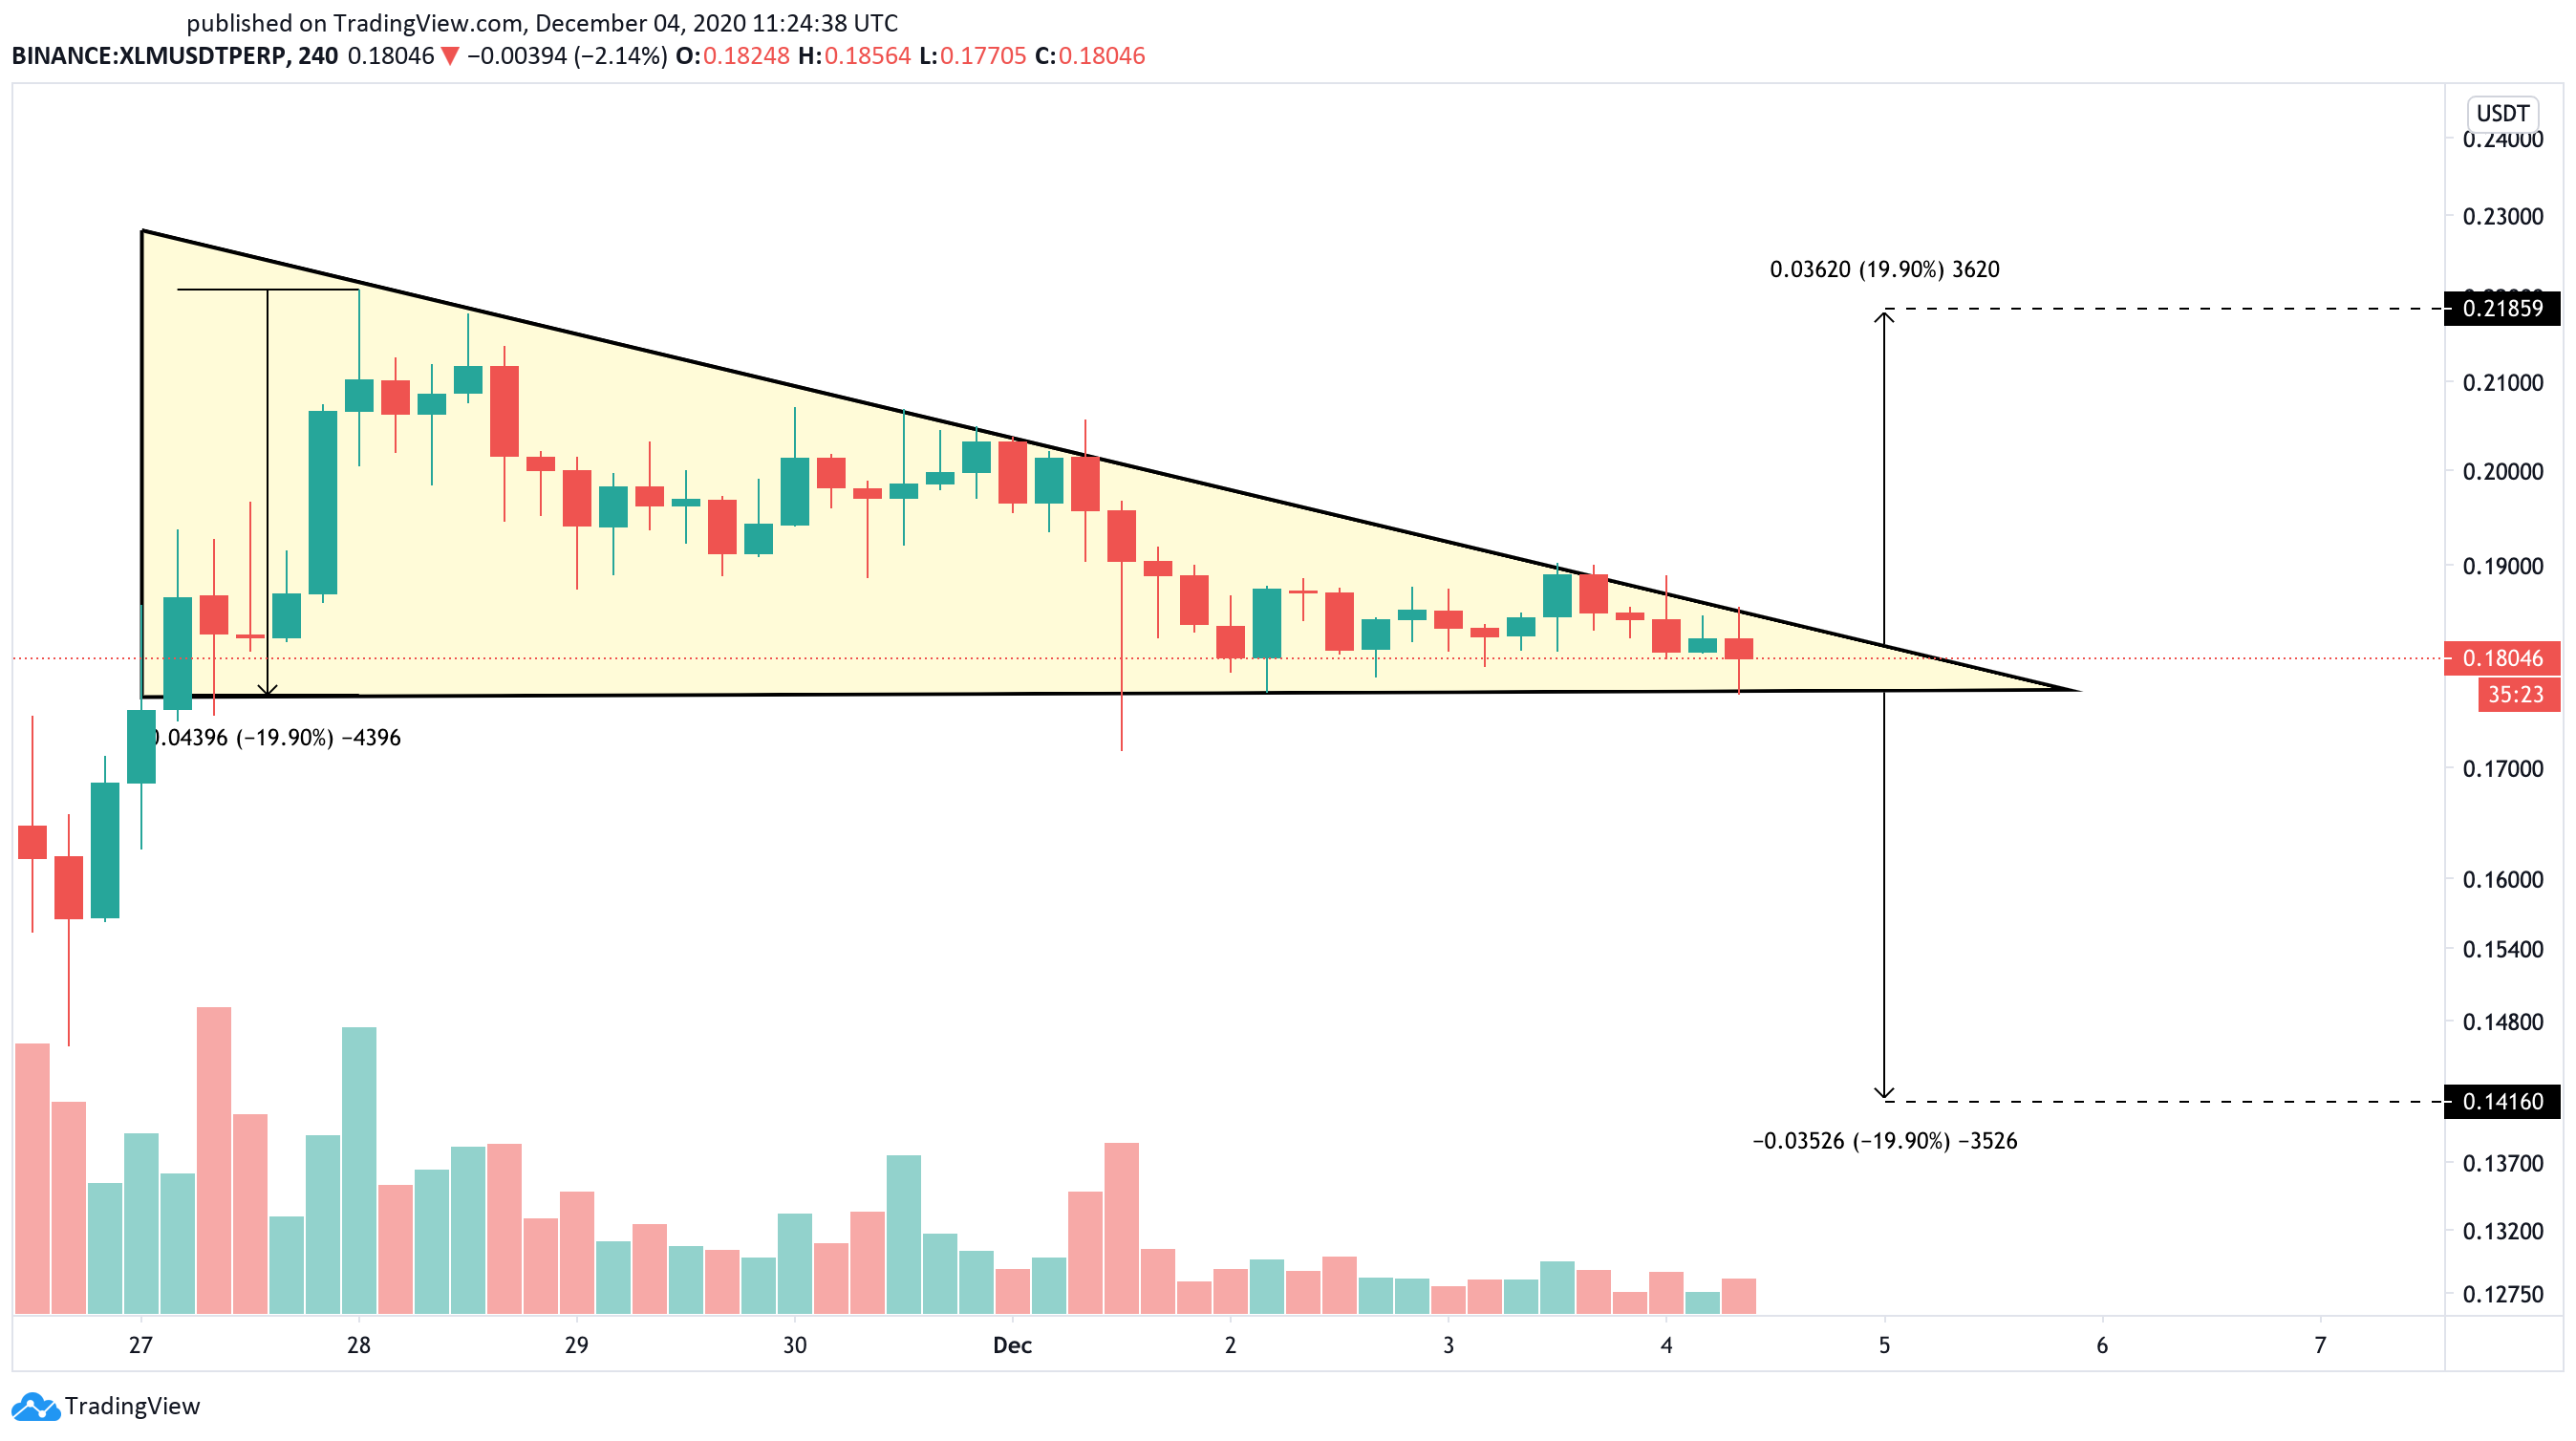
Stellar’s recent price action led to the creation of a descending triangle over the past week. A horizontal support wall developed along with the swing-lows within the 4-hour chart, while a declining trendline was created along with the swing-highs.
A spike in selling pressure at the current price levels could be significant enough to push this altcoin below its underlying support at $0.175.
Slicing through this hurdle would likely see XLM take a 20% nosedive towards $0.14.
This target is determined by measuring the distance between the widest range of the triangle and adding it to the breakout point.
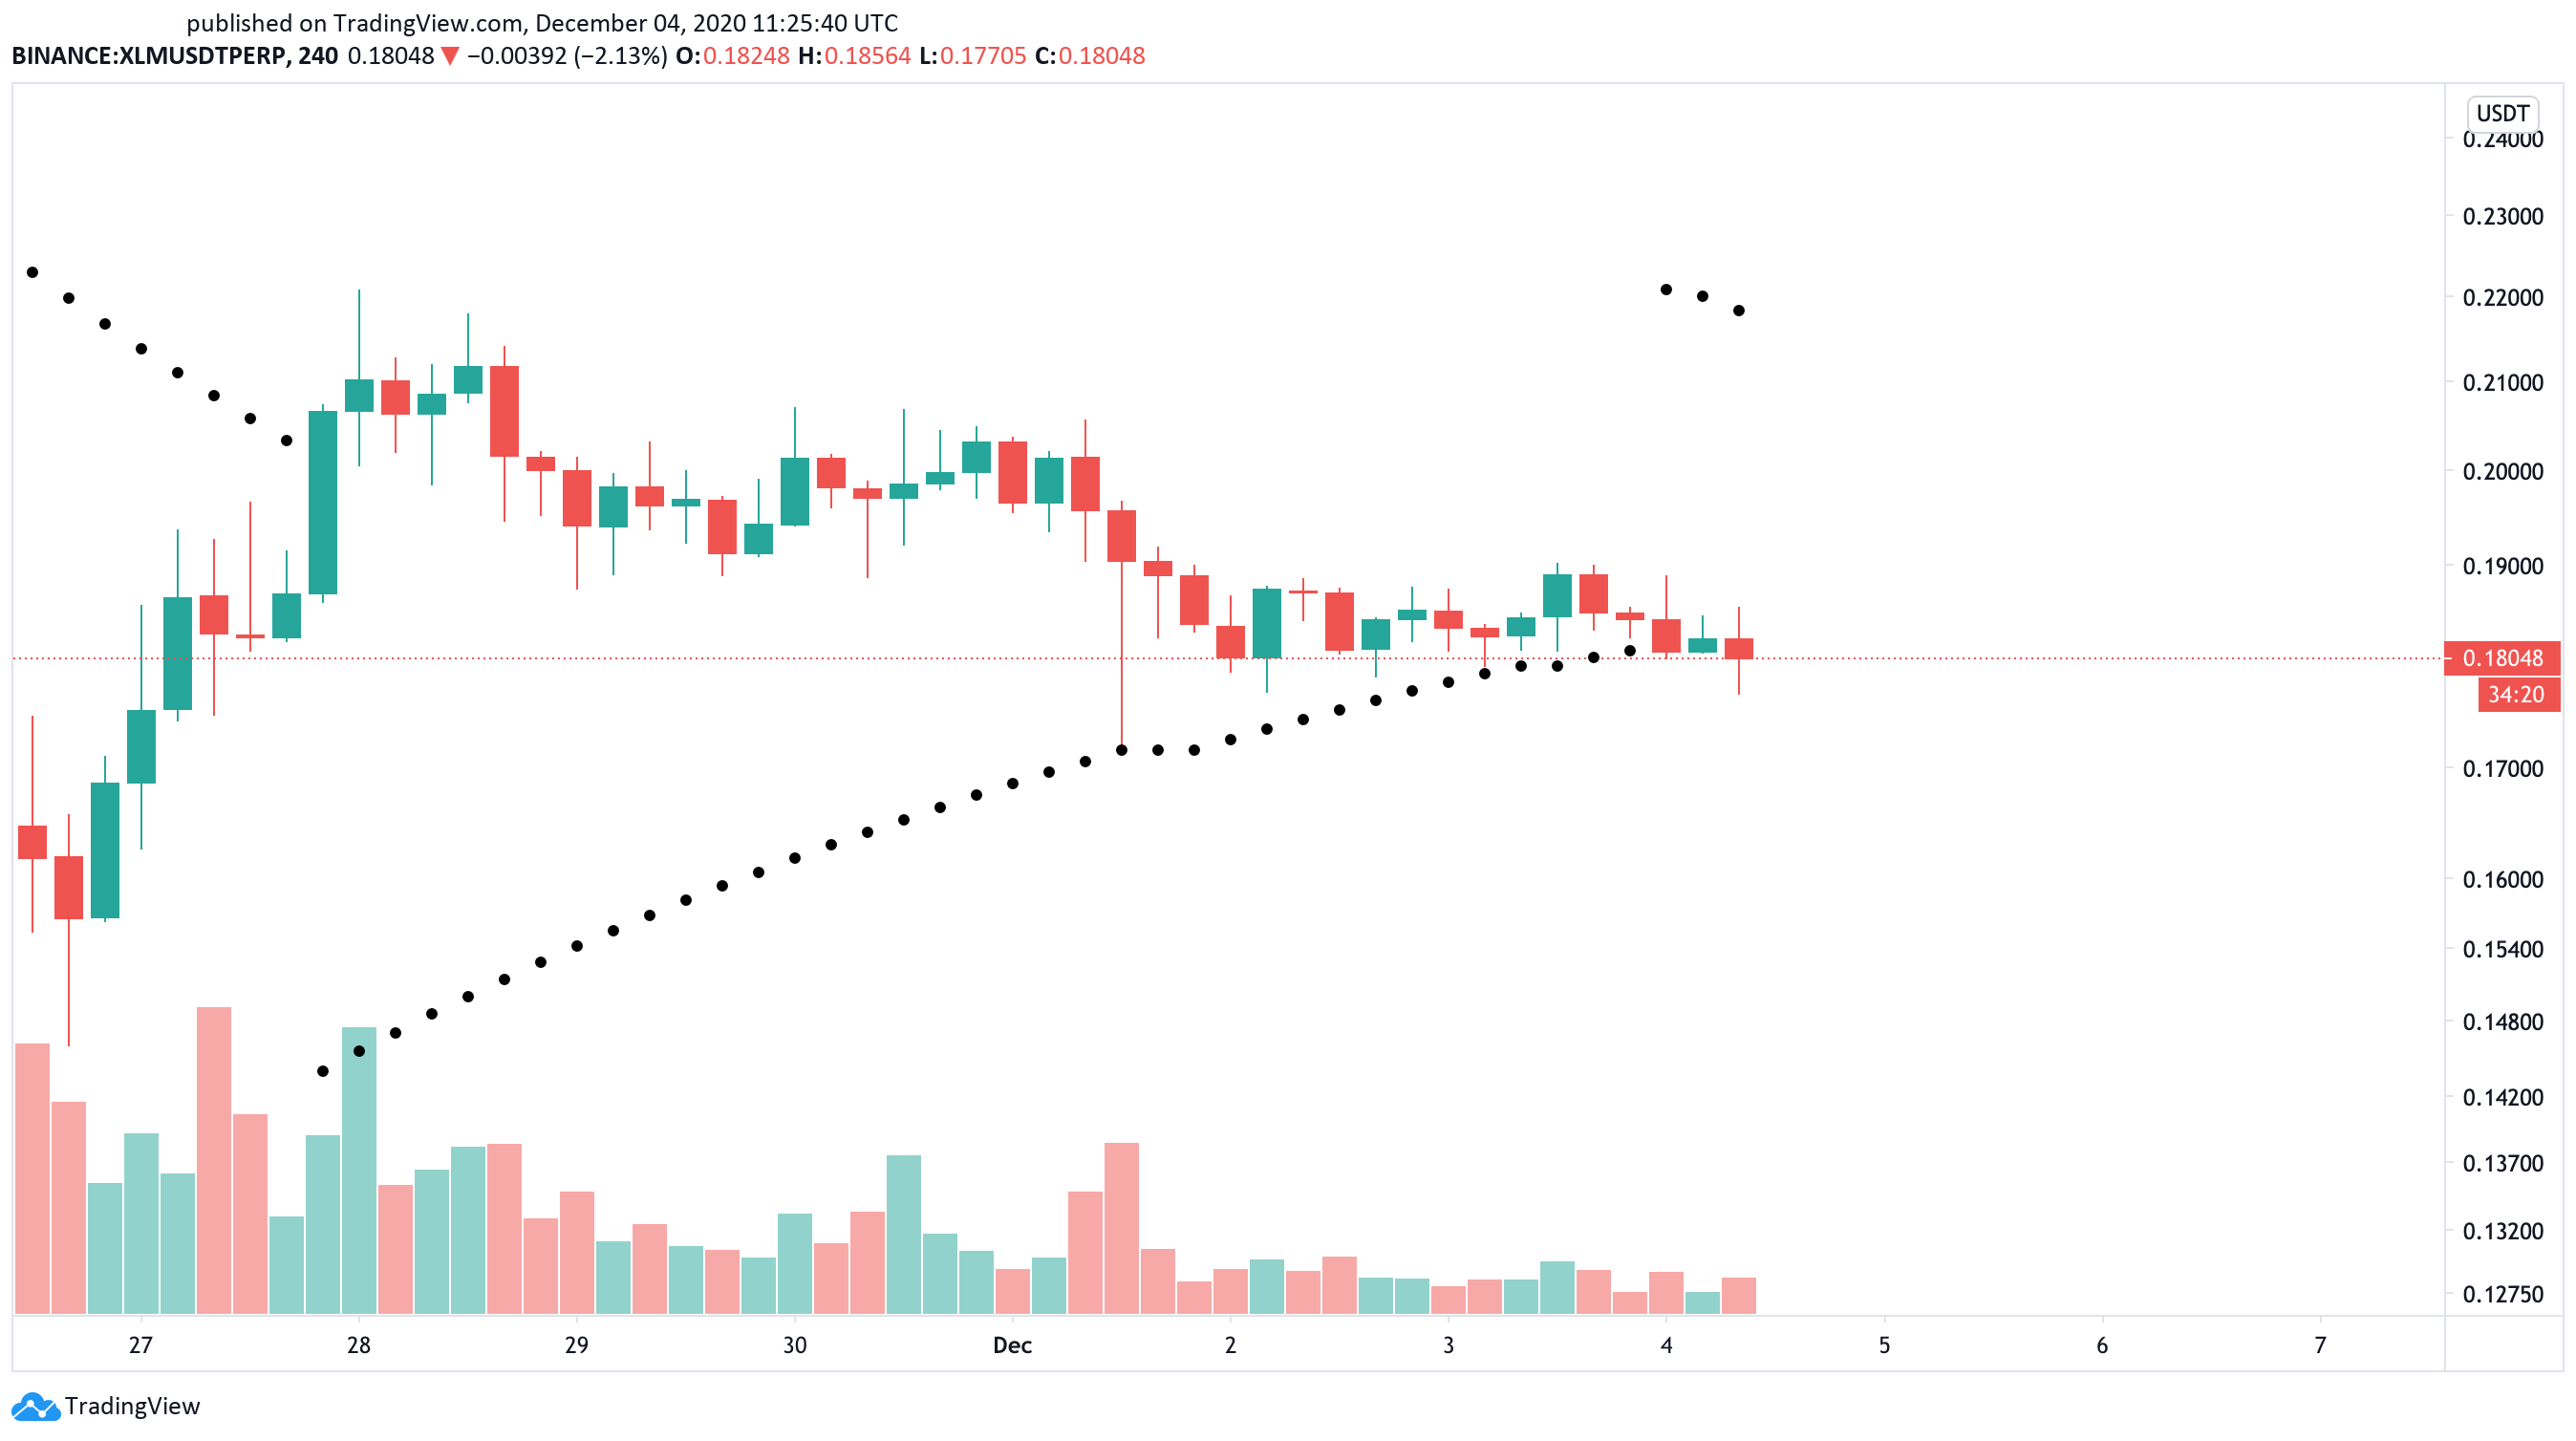
The parabolic stop and reverse, or “SAR,” adds credence to the pessimistic outlook. This trend-following indicator anticipates that Stellar’s uptrend has reached exhaustion within the same time frame.
Each time the stop and reversal points move above an asset’s price, it is considered bearish. Thus, the recent flip indicates that XLM’s trend has changed from bullish to bearish.
The stop and reversal system has been highly effective in determining the course of this cryptocurrency. The parabolic SAR’s last two times flipped from bullish to bearish within the 4-hour chart, XLM’s price dropped by 10% and 30%.
Given the historical moment that the market is going through, waiting for confirmation before entering a short trade is a must since it will help reduce risks.
A 4-hour candlestick close below 50-four-hour exponential moving average will validate the bearish thesis. If this were to happen, the 200-four-hour exponential moving average might be able to keep falling prices at bay.
Coincidentally, this support level sits around the target provided by the descending triangle previously mentioned, at $0.14.
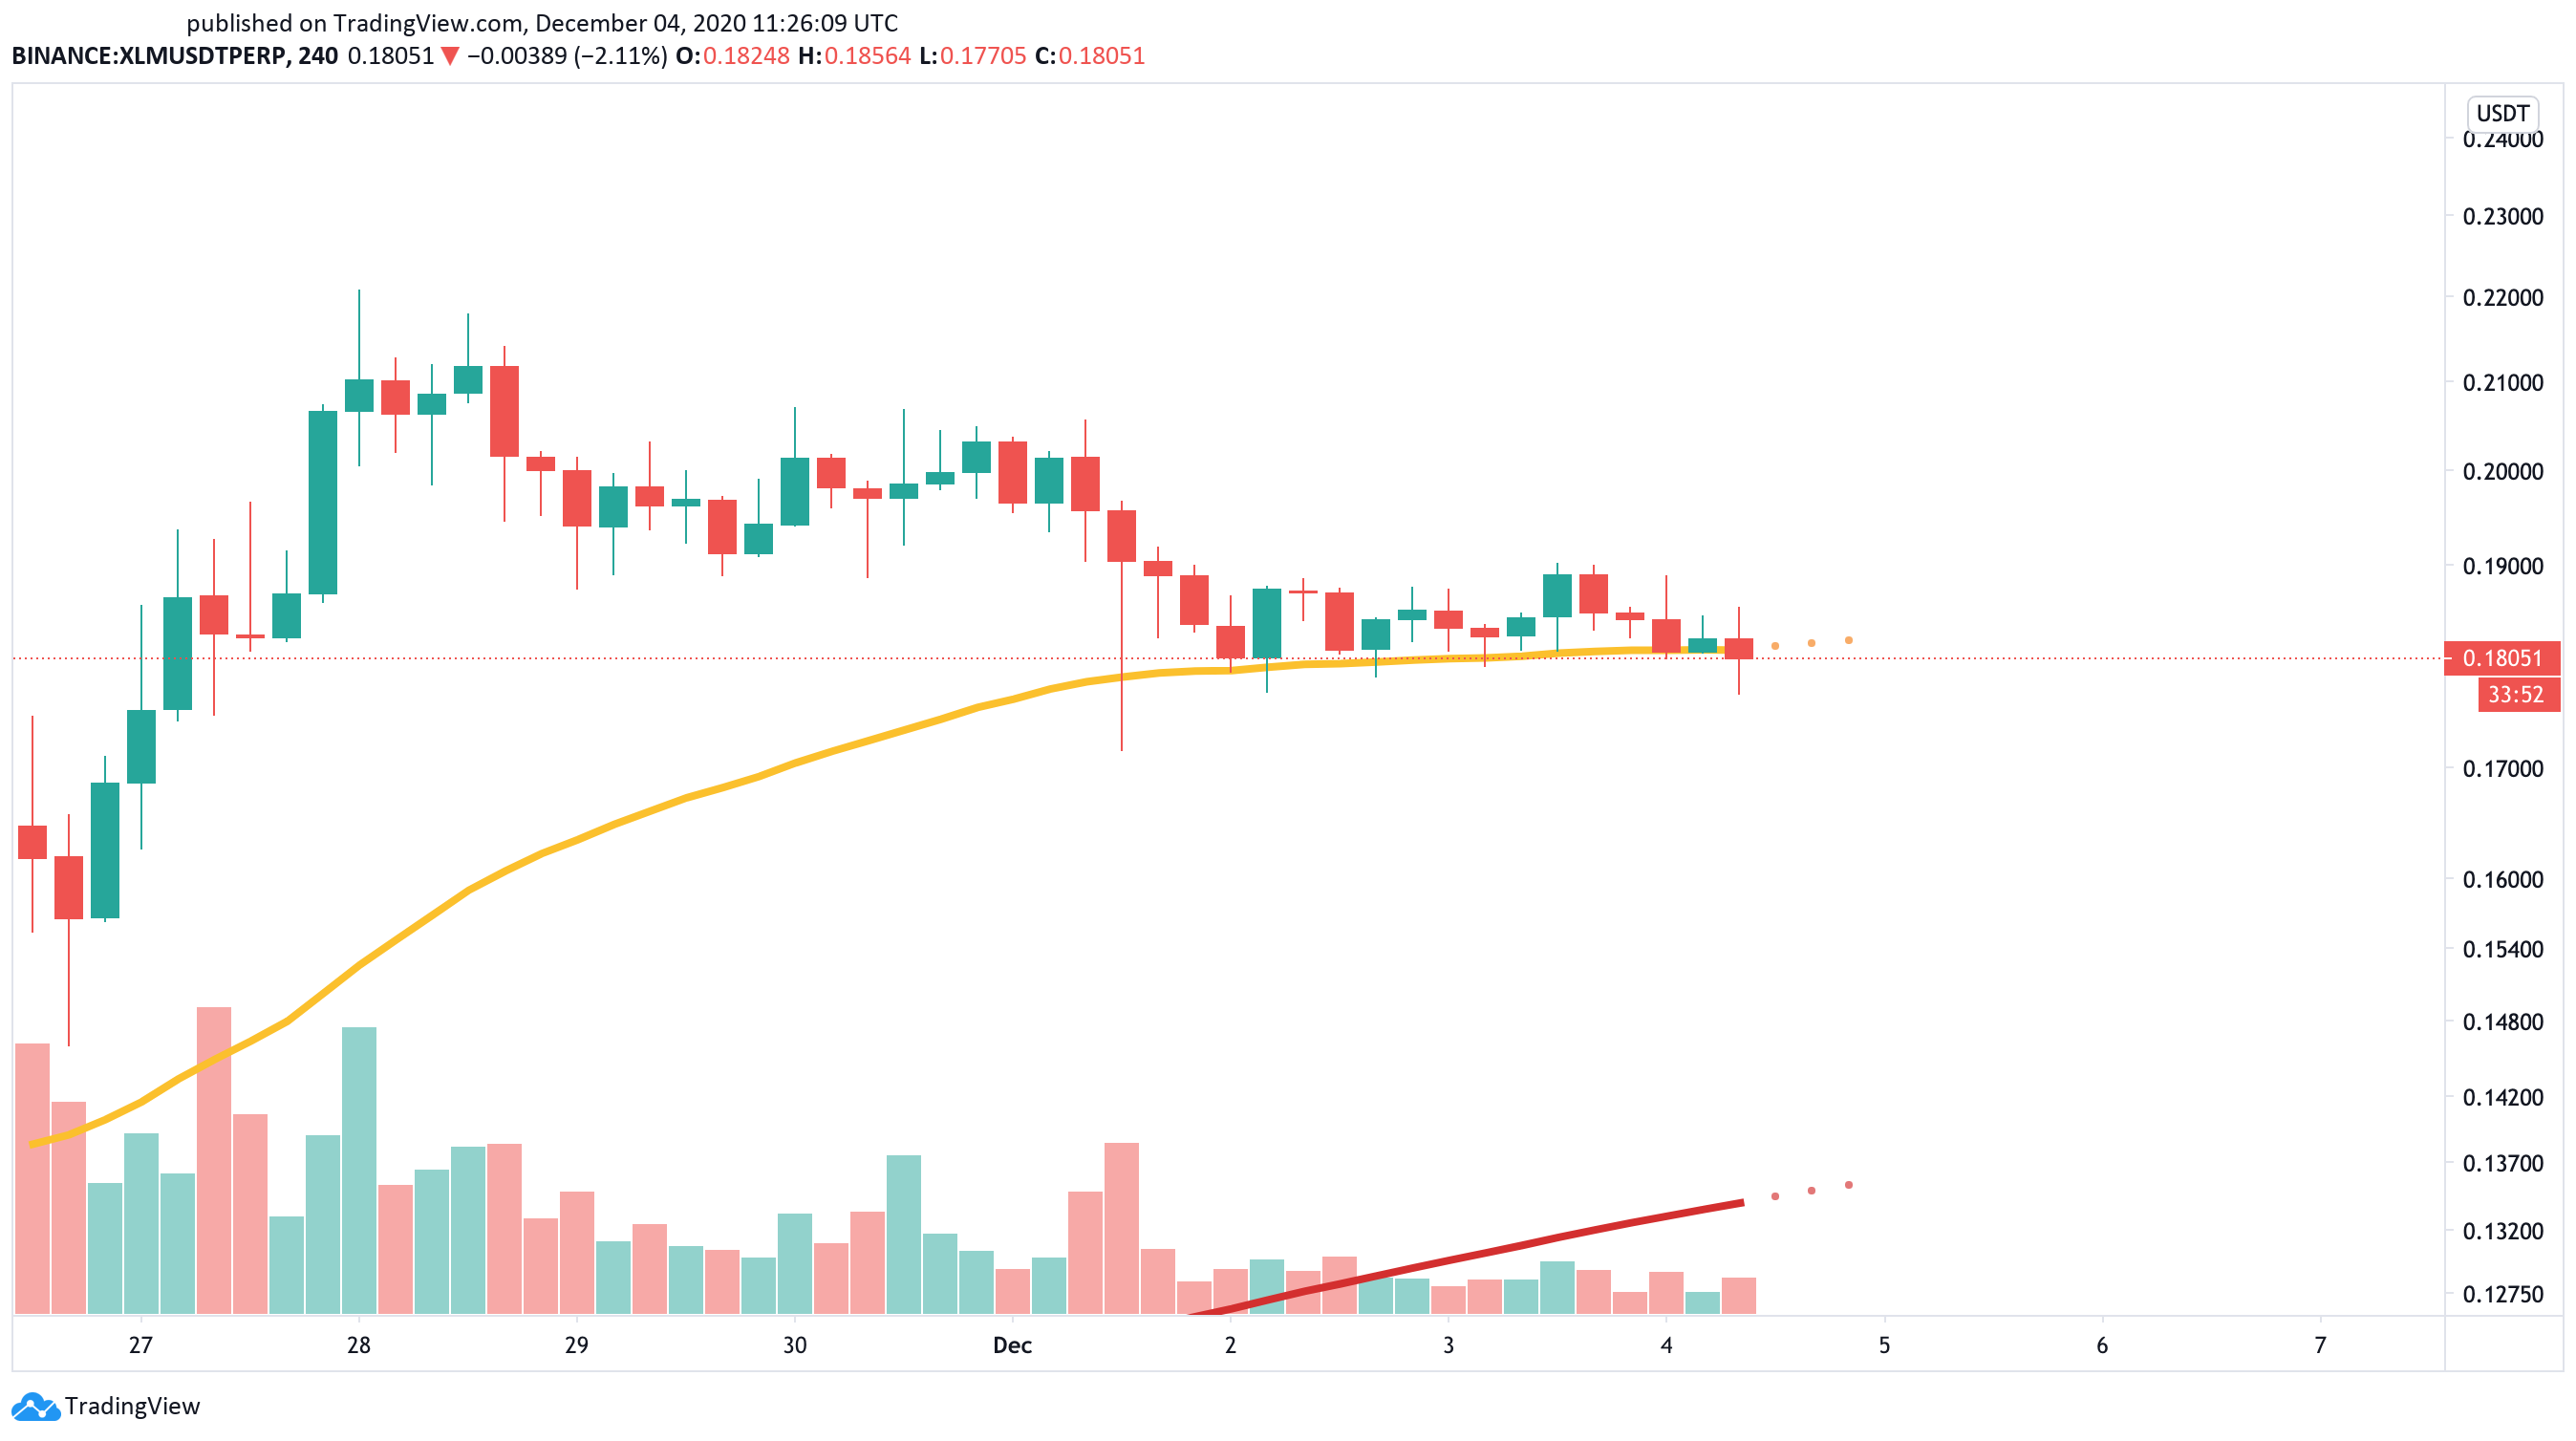
Even though the odds favor the bears, everything will depend on whether Stellar can close below the 50-four-hour exponential moving average. Failing to do so will jeopardize the pessimistic view and lead to further gains.
If buy orders begin to pile up, XLM may even shoot up towards the $0.22 resistance level instead.