Stellar Lumen Price Analysis: Looking Oversold
XLM has hit rock bottom.

Share this article
- Stellar Lumen has a bearish short-term and medium-term trading outlook
- The four-hour time frame shows that a bullish inverted head and shoulders pattern may be forming
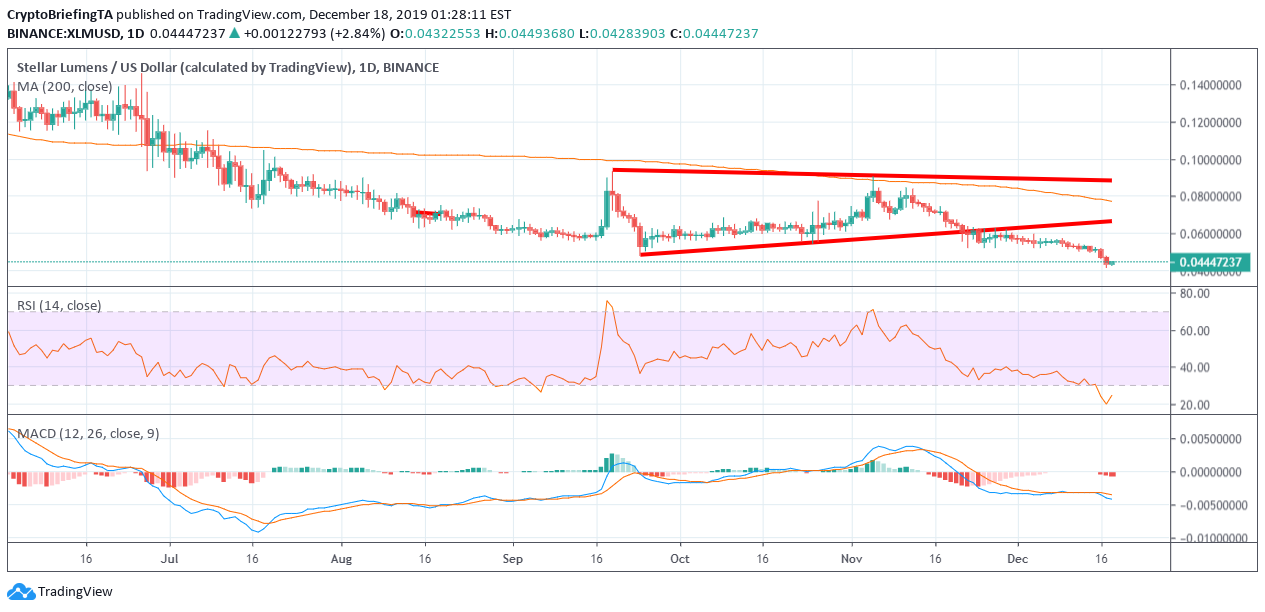
- The daily time frame continues to show that a bearish wedge pattern breakout has occurred
Stellar Lumen has fallen to a fresh multi-year trading low, following Tuesday’s wide-spread cryptocurrency market sell-off.
The XLM/USD pair has lost just over 20 percent of its value since the start of the trading week and trades down by around 40 percent on a four-week basis.
The cryptocurrency is now in a precarious technical position and has looked increasingly weak over the last seven days, quickly racking up daily declines.
The four-hour time frame shows that an inverted head and shoulders pattern may start to form if a recovery occurs from current levels. Although bulls would need to rally price by some 30 percent to form a valid reversal pattern.
The daily time frame shows that a wedge pattern breakout has occurred, with price breaking under the lower end of the wedge pattern and provoking heavy technical selling.
Looking at potential downside targets, the XLM/USD pair is entering unknown territory and appears overstretched to the downside.
The Relative Strength Index on the daily time frame is now its most oversold on record. Again, this could be a hint that recovery may be forthcoming from depressed levels.
As always, moves in the broader market will likely dictate the next directional bias of the XLM/USD pair. A strong recovery across the crypto space would certainly help Stellar Lumen at this stage.

Upside Potential
The four-hour time frame shows that key technical resistance is now located at the $0.057 and $0.062 levels.
Key technical resistance over the medium-term is located at the $0.067 and $0.089 levels.
Downside Potential
The four-hour time frame is showing that the XLM/USD pair has strong long-term technical support around the $0.041 and $0.035 levels.
Sustained weakness under the $0.048 level should be considered extremely bearish for XLM/USD.
Summary
Stellar Lumen has moved to record trading lows, following the latest bearish decline in the broader cryptocurrency market.
The XLM/USD pair could bounce from current levels as the RSI is extremely oversold and the cryptocurrency is approaching bargain levels.
Share this article
