Stellar Lumen / USD Technical Analysis: Shining Brightly

Share this article
- Stellar Lumen remains bullish over the short-term, with the cryptocurrency rising to a multi-month trading high
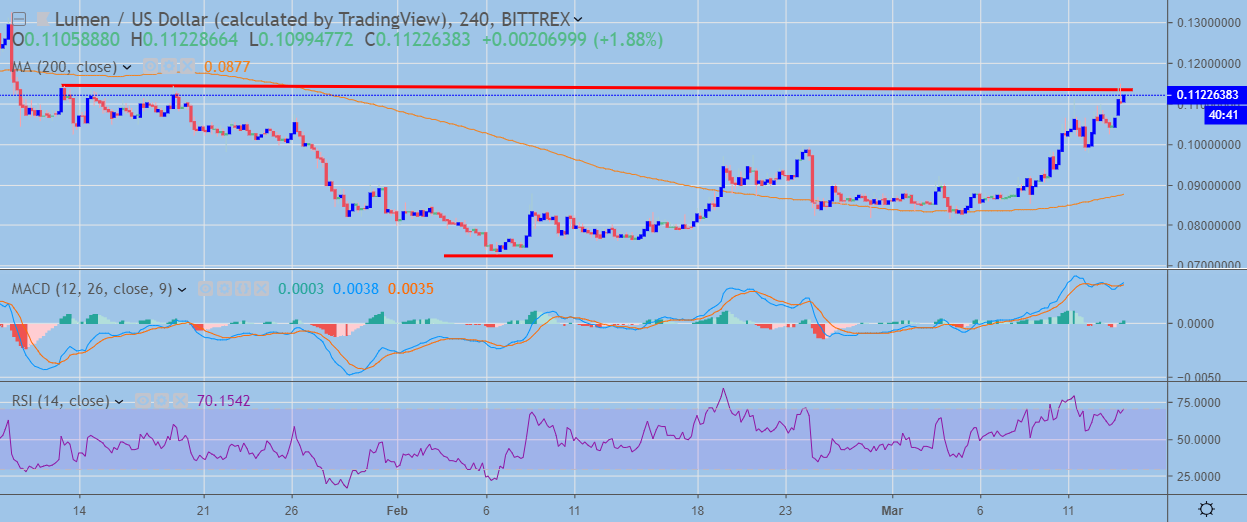
- The XLM / USD pair is probing the neckline of a bullish inverted head and shoulders pattern on the four-hour time frame
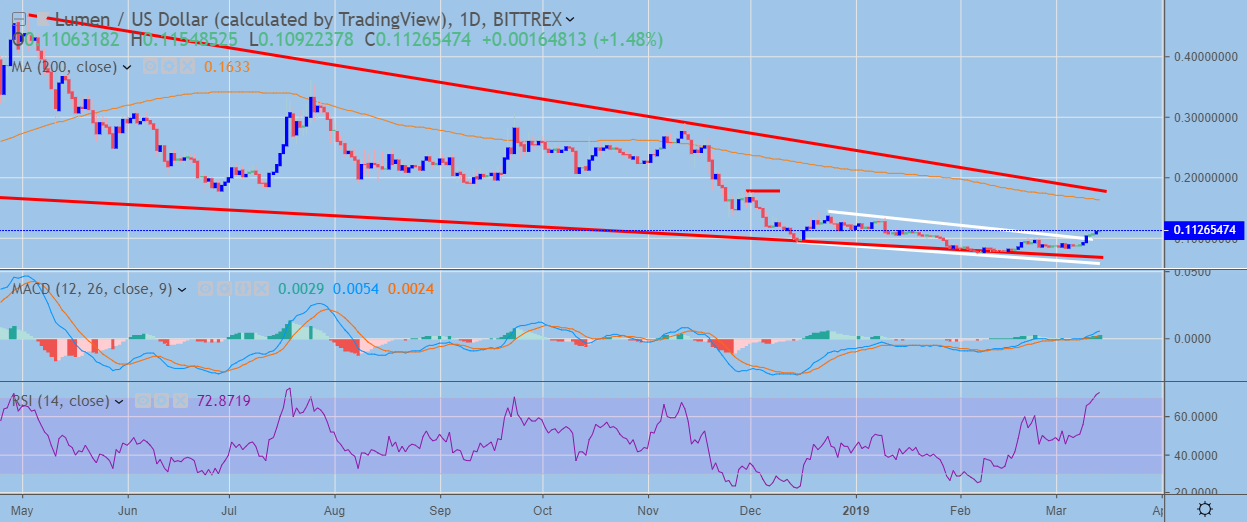
- The daily time frame shows a bullish breakout from a descending price channel
Stellar Lumen / USD Short-term price analysis
Stellar Lumen is bullish over the short-term, with the cryptocurrency posting five consecutive days of trading gains and moving to levels not seen since early 2019.
The four-hour time frame is also showing price testing the neckline of a bullish inverted head and shoulders pattern, with the pattern holding a sizeable upside projection.
Technical indicators remain bullish on the four-hour time frame, although the recent rally in the XLM / USD pair has created some minor pockets of bearish MACD divergence.

XLM / USD H4 Chart (Source: TradingView)
Pattern Watch
Traders should note that if the XLM / USD pair advances towards the December 24th trading high, a much larger inverted head and shoulders pattern will take shape.
MACD Indicator
The MACD indicator is bullish on the four-hour time frame, although the recent rally has created a small amount of bearish MACD price divergence.
Relative Strength Index
The RSI indicator is bullish on the four-hour time frame, although it is also showing negative price divergence.
Fundamental Analysis
Stellar has been one of the best performing tokens of late, with good news all around. On March 13, Coinbase Pro announced the support of Stellar on its blog. Prior to that, the German media company Börsenmedien AG, announced the acquisition of a 5% stake in SatoshiPay, a micropayment solution, that utilizes Stellar blockchain.
Furthermore, the community is expecting some good announcements from Stellar during the Money 20/20 Asia Conference that will be held in Singapore during March 19-21. Jed McCaleb, co-founder of Stellar, is slated as one of the speakers.
Stellar Lumen / USD Medium-term price analysis
Stellar Lumen has a neutral trading bias over the medium-time frame, with the XLM / USD pair recently breaking above the top of a descending price channel that the cryptocurrency has been trapped within since December 2018.
With the technical breakout now underway, we may see the cryptocurrency starting to target towards its 200-day moving average over the medium-term.
Traders should note that the daily time frame shows bullish MACD price divergence that extends towards the November 30th, 2018 trading high.

XLM / USD Daily Chart (Source: TradingView)
Pattern Watch
Aside from the descending price channel, the daily time frame is also showing a large falling wedge pattern which has been in play since May 2018.
MACD Indicator
The MACD indicator is bullish on the daily time frame and is currently generating a strong bullish trading signal.
Relative Strength Indicator
The RSI indicator is bullish on the daily time frame, although it has now moved into overbought territory.
Fundamental Analysis
In the medium term, expectations of new partnership announcements may continue to support the uptrend. However, an absence of positive news at the Money 20/20 Asia Conference, would probably result in a correction, especially given the overbought nature of the RSI Indicator.
Make sure to read our detailed analysis of Stellar in the DARE report here.
Conclusion
Stellar Lumen’s technical outlook continues to improve on both time horizons, with the recent breakout from the descending price channel on the daily time frame the latest positive development for the XLM / USD pair.
The inverted head and shoulders pattern on the four-hour time frame and the bullish MACD divergence still present on the daily time frame highlight that the cryptocurrency still has considerable upside potential.
For an introductory course on Stellar head over to our coin guide here.
Decentral Media, Inc., the publisher of Crypto Briefing, is not an investment advisor and does not offer or provide investment advice or other financial advice. Nothing on this website constitutes, or should be relied on as, investment advice or financial advice of any kind. Specifically, none of the information on this website constitutes, or should be relied on as, a suggestion, offer, or other solicitation to engage in, or refrain from engaging in, any purchase, sale, or any other any investment-related activity with respect to any transaction. You should never make an investment decision on an investment based solely on the information on our website, and you should never interpret or otherwise rely on any of the information on this website as investment advice. We strongly recommend that you consult a licensed investment advisor or other qualified financial professional if you are seeking investment advice on an investment.
