Shutterstock image by Aleksey Ivanov
Stellar Lumens Primed to Recover Lost Ground
Stellar's XLM token is breaking out as several technical indicators have turned bullish.
Stellar’s market outlook seems to be improving in the aftermath of a three-week-long consolidation period.
Stellar Is Breaking Out
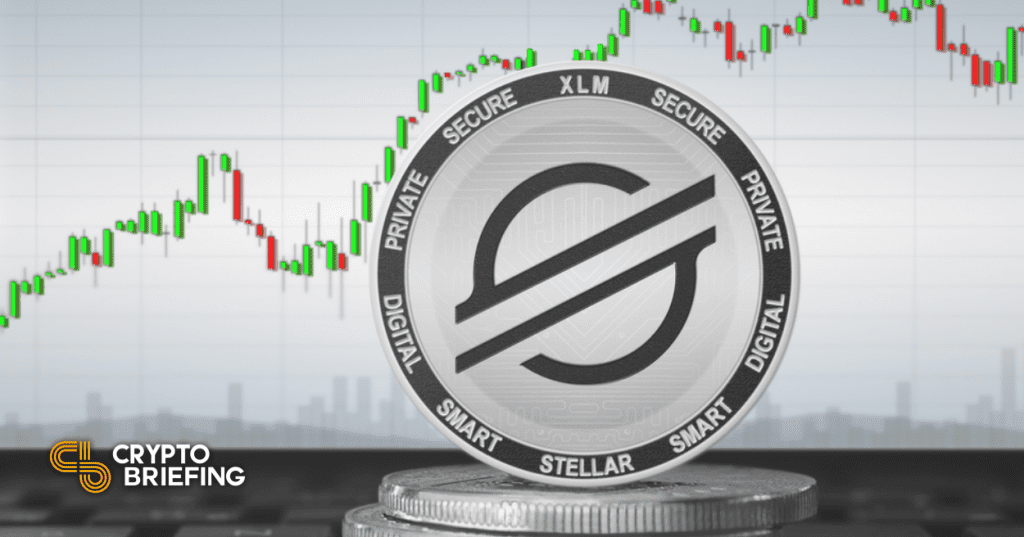
Stellar Lumens (XLM), the eleventh-largest cryptocurrency by market cap, appears to be breaking out of a descending triangle that has been developing on its 4-hour chart since Jan. 7.
Since then, the price of XLM has been making a series of lower highs. Meanwhile, the $0.230 support level has been able to prevent the coin’s price from dropping further.
A recent spike in the buying pressure behind Stellar was significant enough to push the coin’s price through the triangle’s hypotenuse at $0.253. Now that XLM has regained this price hurdle as support, the chances for a 45.50% upswing to $0.376 have increased.
Stop and Reverse
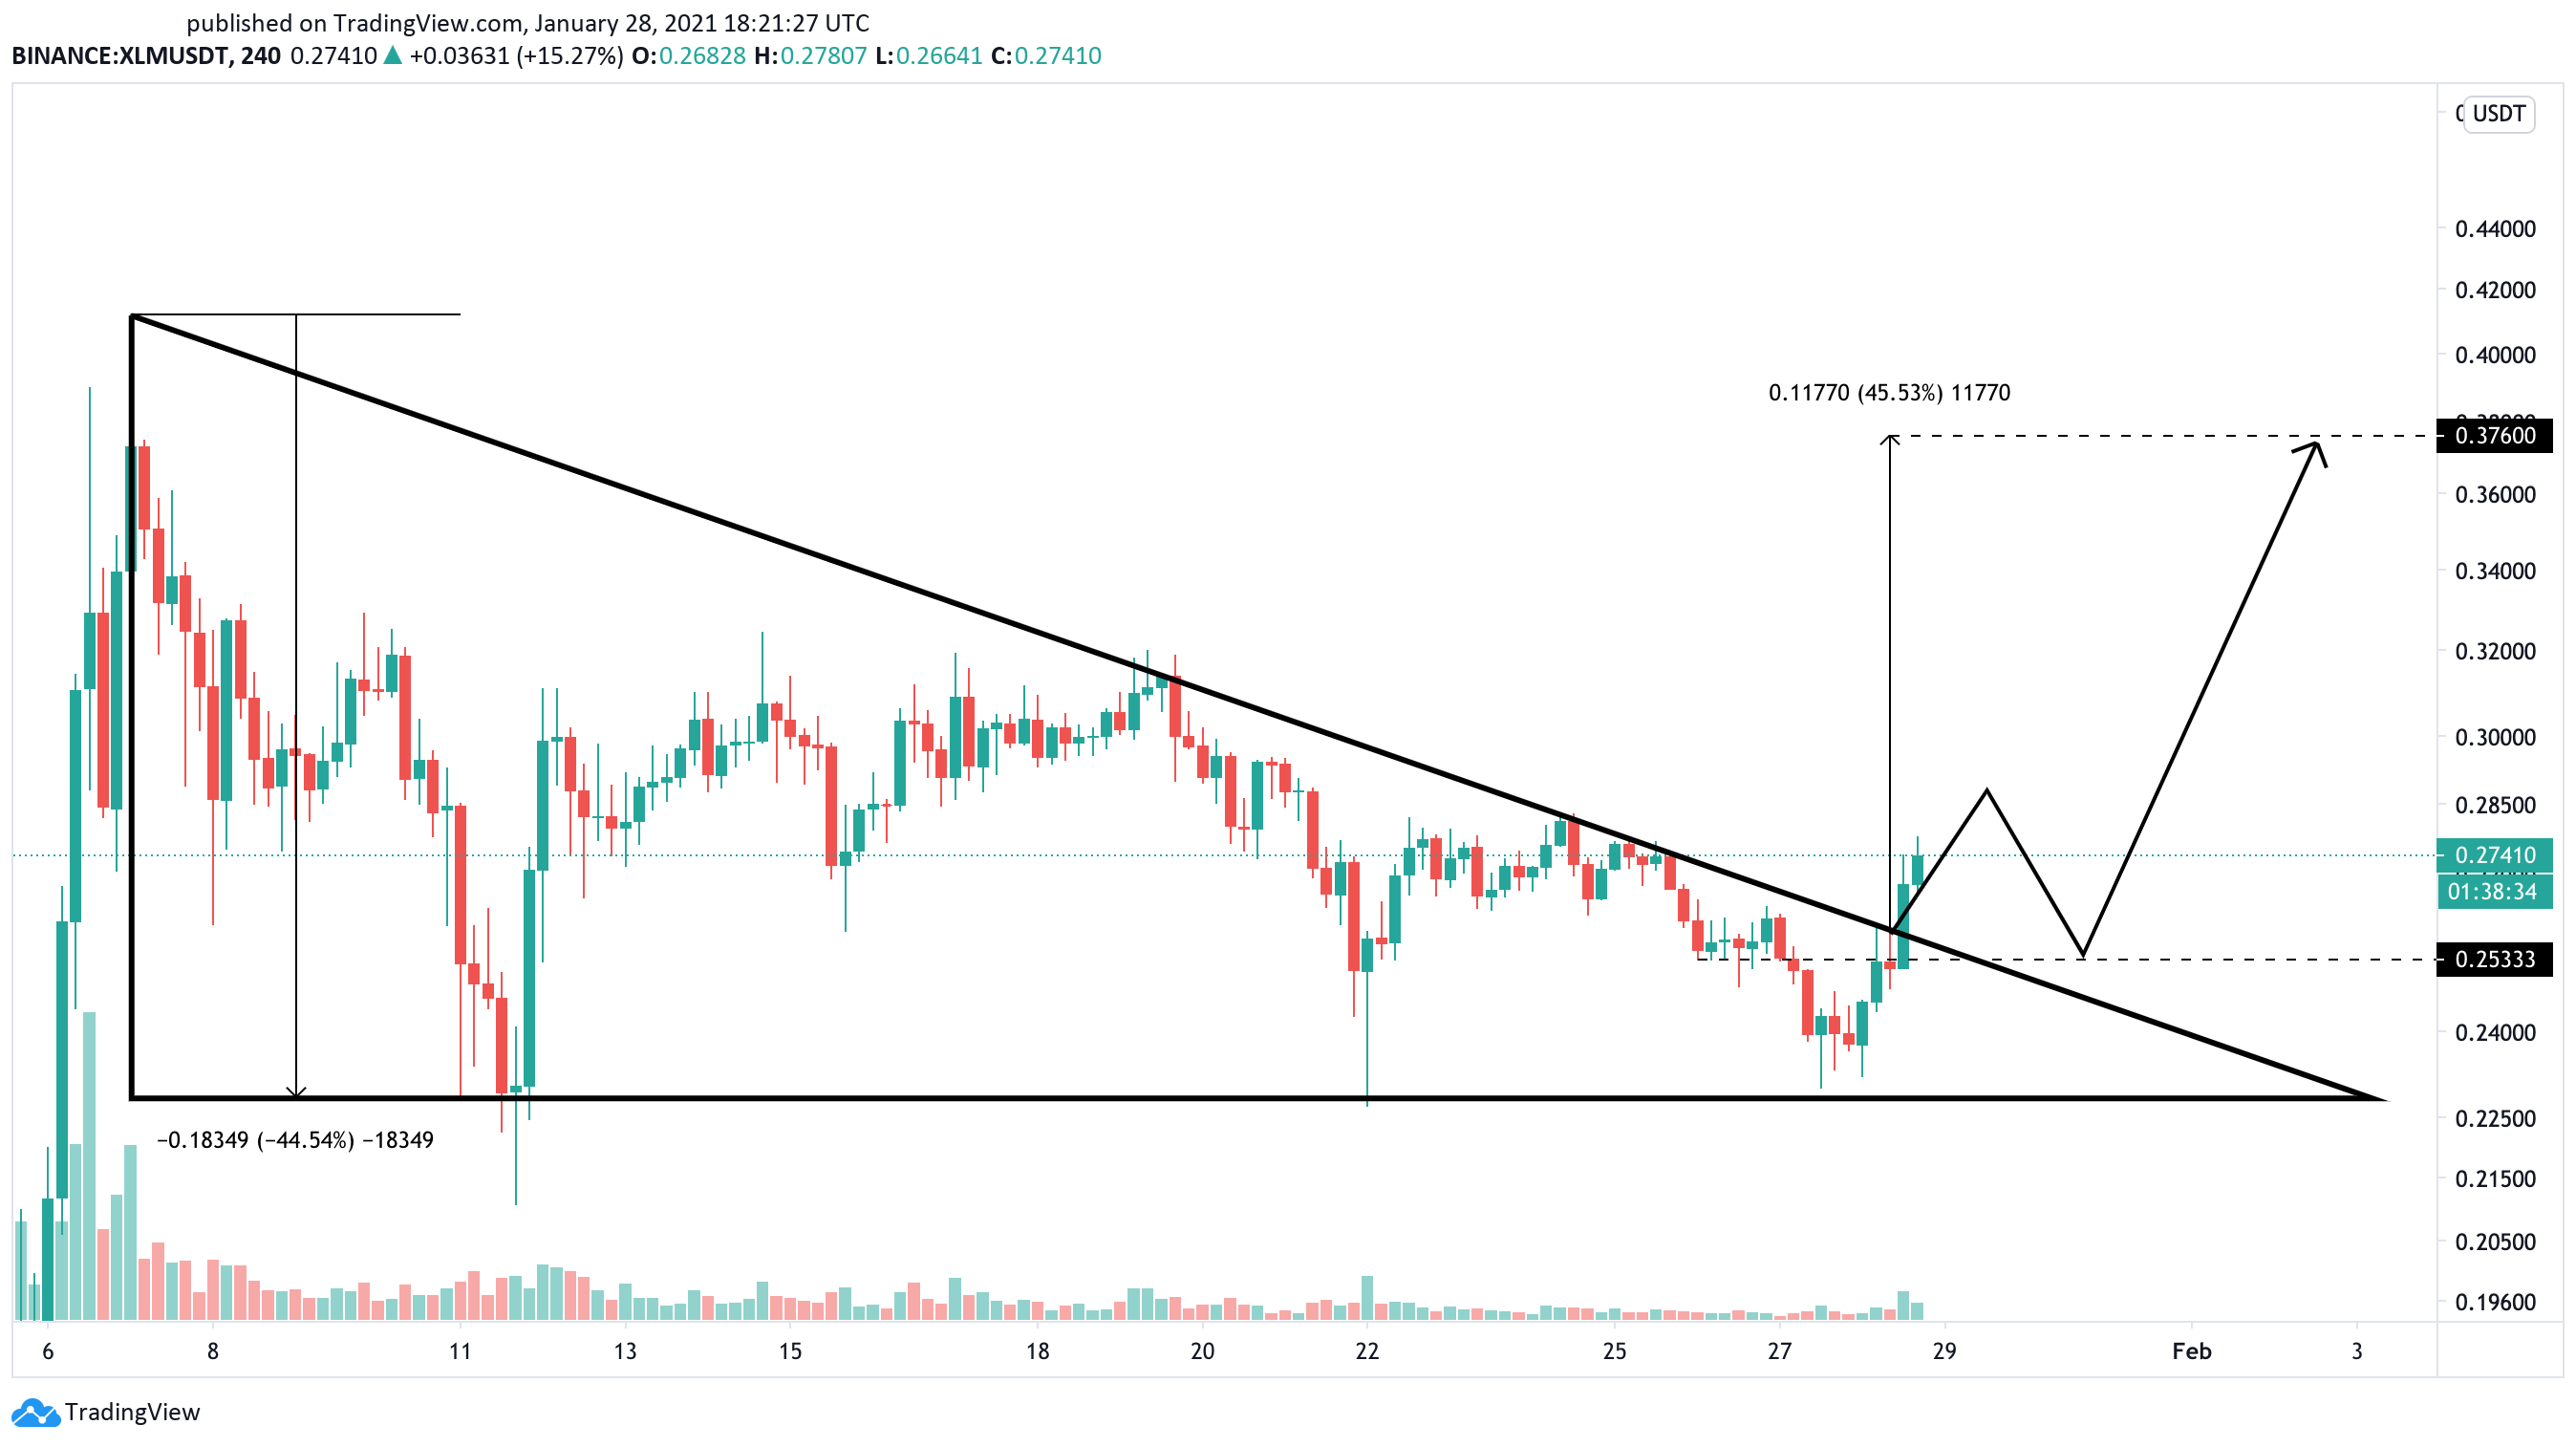
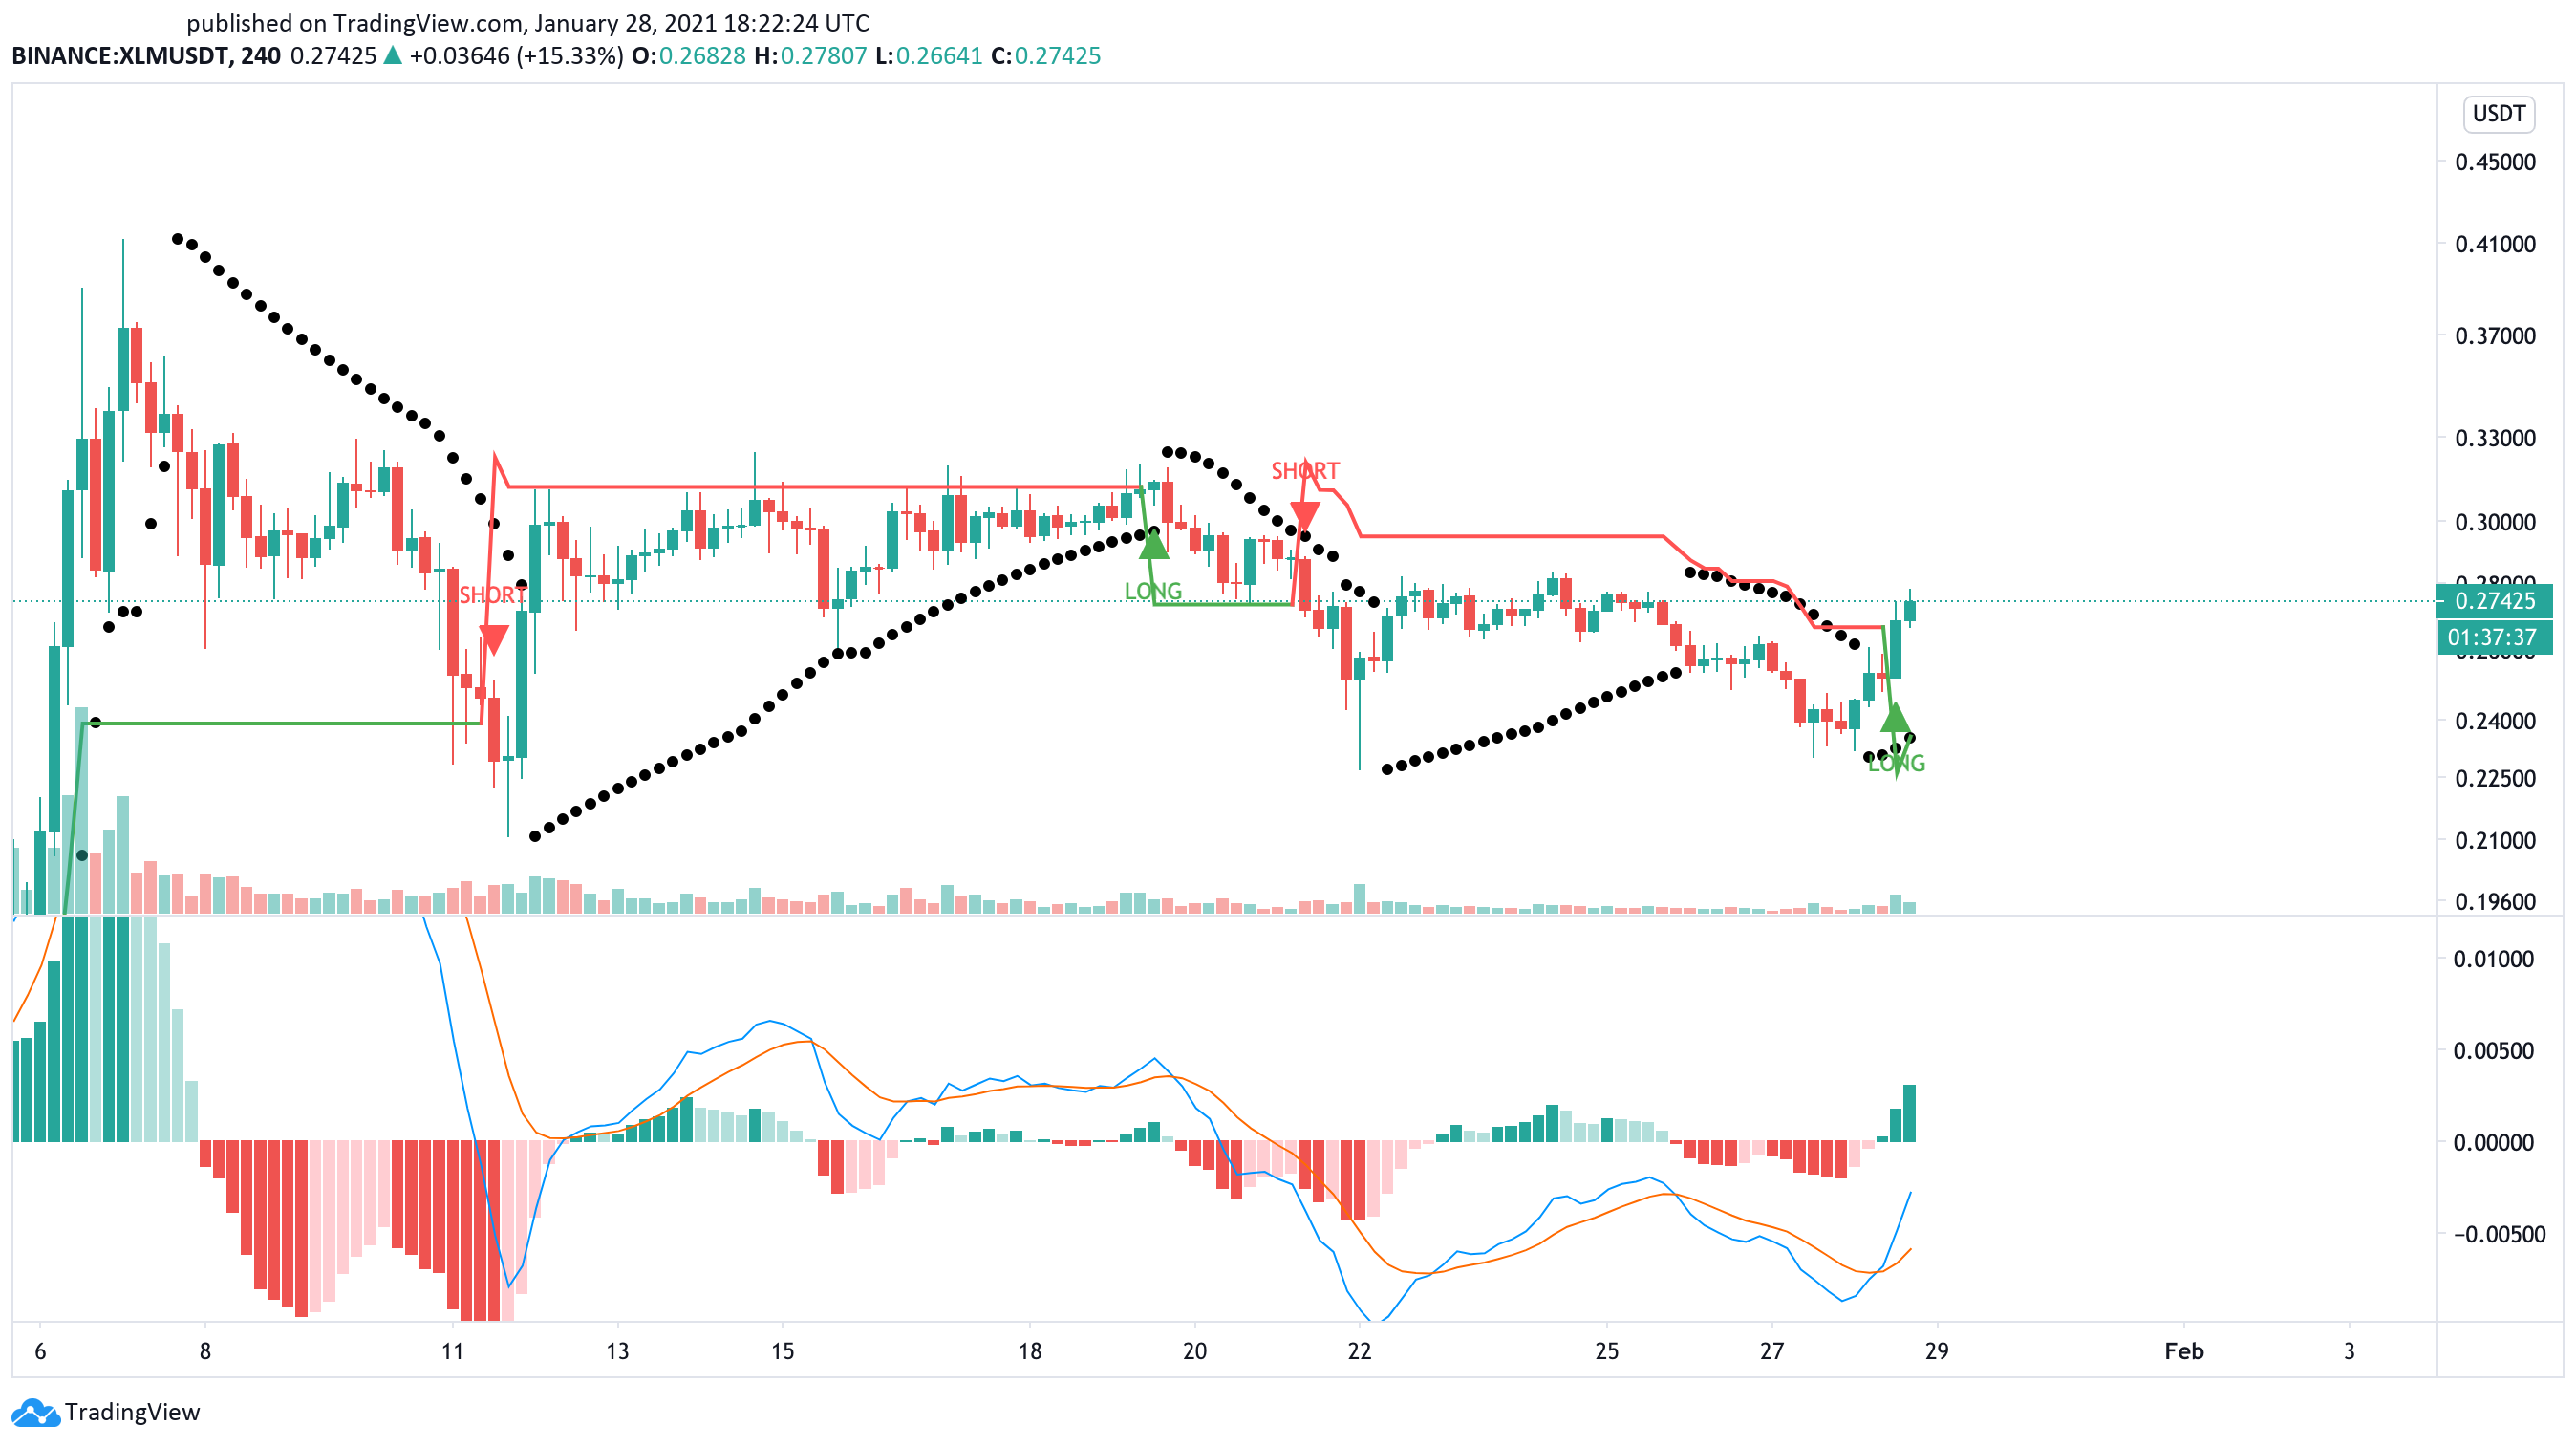
The parabolic stop and reverse, or “SAR,” adds credence to the optimistic outlook. This trend-following indicator forecasts that Stellar’s consolidation period came to an end.
Each time the stop and reversal points move below an asset’s price, that event is considered to be a positive sign. Therefore, the recent flip over suggests that XLM is poised to advance further.
The moving average convergence divergence, or MACD, also turned bullish following the golden cross between the 12 four-hour exponential moving average and the 26 four-hour exponential moving average. Meanwhile, the SuperTrend indicator flashed a “long” signal as Stellar sliced through the $0.253 resistance.
All of these technical indexes help validate the descending triangle’s price projection for XLM.
Regardless, investors must remain cautious as the cryptocurrency market remains at risk of a painful correction.
A downswing below the $0.230 support level could invalidate the bullish thesis. That could cause the parabolic SAR and SuperTrend indicator to turn bearish, leading XLM to plummet toward $0.123.
Disclosure: At the time of writing, this author held Bitcoin and Ethereum.