Tezos Price Analysis XTZ / USD: Breaking Resistances
XTZ could add another 30% to its value.

Share this article
- Tezos now has a bullish short-term and medium-term trading bias
- The four-hour time frame shows that large inverted head and shoulders pattern has formed
- The daily time frame highlights and an even larger bullish pattern
Tezos has made major strides this week, with the cryptocurrency rallying to its highest trading level mid-August and gaining well-over thirty percent in value since the start of November.
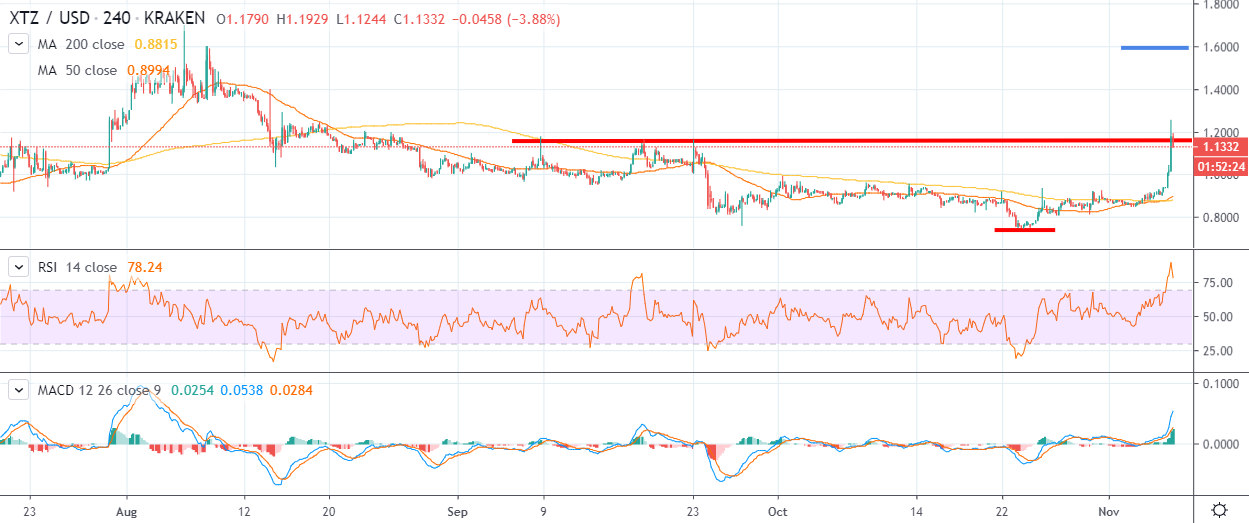
The rally has pulled back sharply from a high of $1.25, although the XTZ / USD pair is starting to stabilize around its 50-day moving average for the first time in nearly three months.
Positive signs had started to emerge earlier this week after the cryptocurrency exhibited bullish price-action and performed a series of daily price closes back above its 200-day moving average.
The four-hour time frame shows that the XTZ / USD pair is starting to trade around the neckline of the bullish inverted head and shoulders pattern, with a $0.35 upside projection.
If bulls can start to ignite the bullish pattern, the XTZ / USD could eventually rally towards the $1.50 level and add a further thirty percent to its trading value.
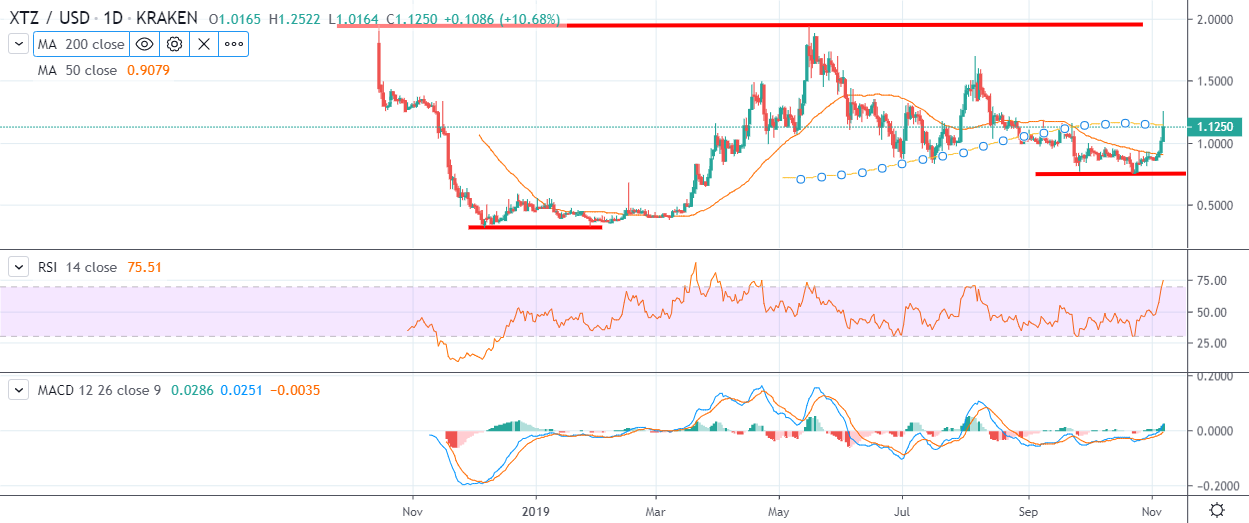
Interestingly, the daily time frame highlights an even larger inverted head and shoulders pattern, with the neckline of the pattern located around the $1.95 resistance level.
Short-term analysis shows that dip-buying is now favored. Buying technical pullbacks towards the $1.00 support level is favored to initiate long positions. Only a sustained breach under the $0.90 level can negate the overall bullish outlook towards Tezos.
According to the latest sentiment data from TheTIE.io, the short-term sentiment towards Tezos is bullish, at 88.00 %, while the overall long-term sentiment towards the cryptocurrency is also bullish, at 75.00%.
Upside Potential
The four-hour time frame shows that a large inverted head and shoulders pattern has formed, with the $1.15 level acting as the neckline of the bullish pattern.
Key technical resistance for the XTZ / USD pair above the bullish pattern is currently located at the $1.25 and the $1.55 levels.
Downside Potential
The four-hour time frame is showing that the XTZ / USD pair’s 200-period moving average on the four-hour time frame is currently providing the strongest form of short-term technical support, around the $0.90 level.
The daily time frame shows that the $1.00 level offers strong technical support and remains a key area that sellers may attack to prompt a stronger decline.
Summary
Tezos shows tremendous upside potential over both the short and medium-term. Bulls now need to stabilize the cryptocurrency above the $1.15 level to secure further gains.
The XTZ / USD pair could add a further thirty percent to its value if it reaches its overall upside objective.
Check out the basics of Tezos in coin guide.
Share this article
