Tezos and Stellar Lumens Poised for a Correction
Tezos and Stellar Lumens have managed to recover all of their losses incurred during Black Thursday, but different indicators show that the uptrend may soon come to an end.

Key Takeaways
- Tezos is reaching a critical level of resistance that may cause trouble for the continuity of its uptrend.
- Along the same lines, Stellar Lumens is seeing a number of on-chain metrics and technical indicators flashing sell signals.
- A further increase in the selling pressure behind XTZ and XLM could see them drop to $2.35 and $0.05, respectively.
Share this article
Tezos and Stellar Lumens have enjoyed an impressive rally over the last three days, with their prices rising more than 30%. Now, XTZ and XLM appear to be approaching an exhaustion point with multiple indicators pointing to an impending correction.
Tezos Prepares for a Retracement
Two weeks ago, Tezos co-founder Kathleen Breitman alluded that her upcoming blockchain-project will not run on top of her protocol. But, that wasn’t enough to stop XTZ from surging.
Indeed, XTZ has fully recovered from its Mar. 12 crash, rising nearly 175% over the past month.
The smart contracts token went from trading at a low of $1 to a recent high of $2.75. However, this price level could represent an opportunity for investors to profit from the substantial upward advance.
In fact, The TD sequential indicator is currently presenting a sell signal in the form of a green nine candlestick on XTZ’s 1-day chart. This bearish formation forecasts a one to four candlesticks correction before the continuation of the uptrend.
Based on historical data, the TD setup has been quite accurate at predicting local tops. This technical index has presented a similar sell signal twice over the past month.
Both of these bearish patterns were validated, pushing the price of Tezos down 17.7% and 16.3%, respectively.
Given the accuracy of the TD sequential indicator’s previous retracement signals for Tezos, it is reasonable to assume that history will repeat itself.
If it does, a spike in the selling pressure behind Tezos could see it drop to the 23.6% Fibonacci retracement level. This support barrier is sitting around $2.4.
Nevertheless, the bullish outlook cannot be disregarded in a market as unpredictable as crypto. Therefore, a further increase in demand for Tezos around the current price levels could send its price up towards the setup trendline around $3.
Breaking above this resistance level will increase the odds for an upswing to the 127.2% Fibonacci retracement level. This supply wall is located around $3.2.
Stellar Gives Off Multiple Bearish Signals
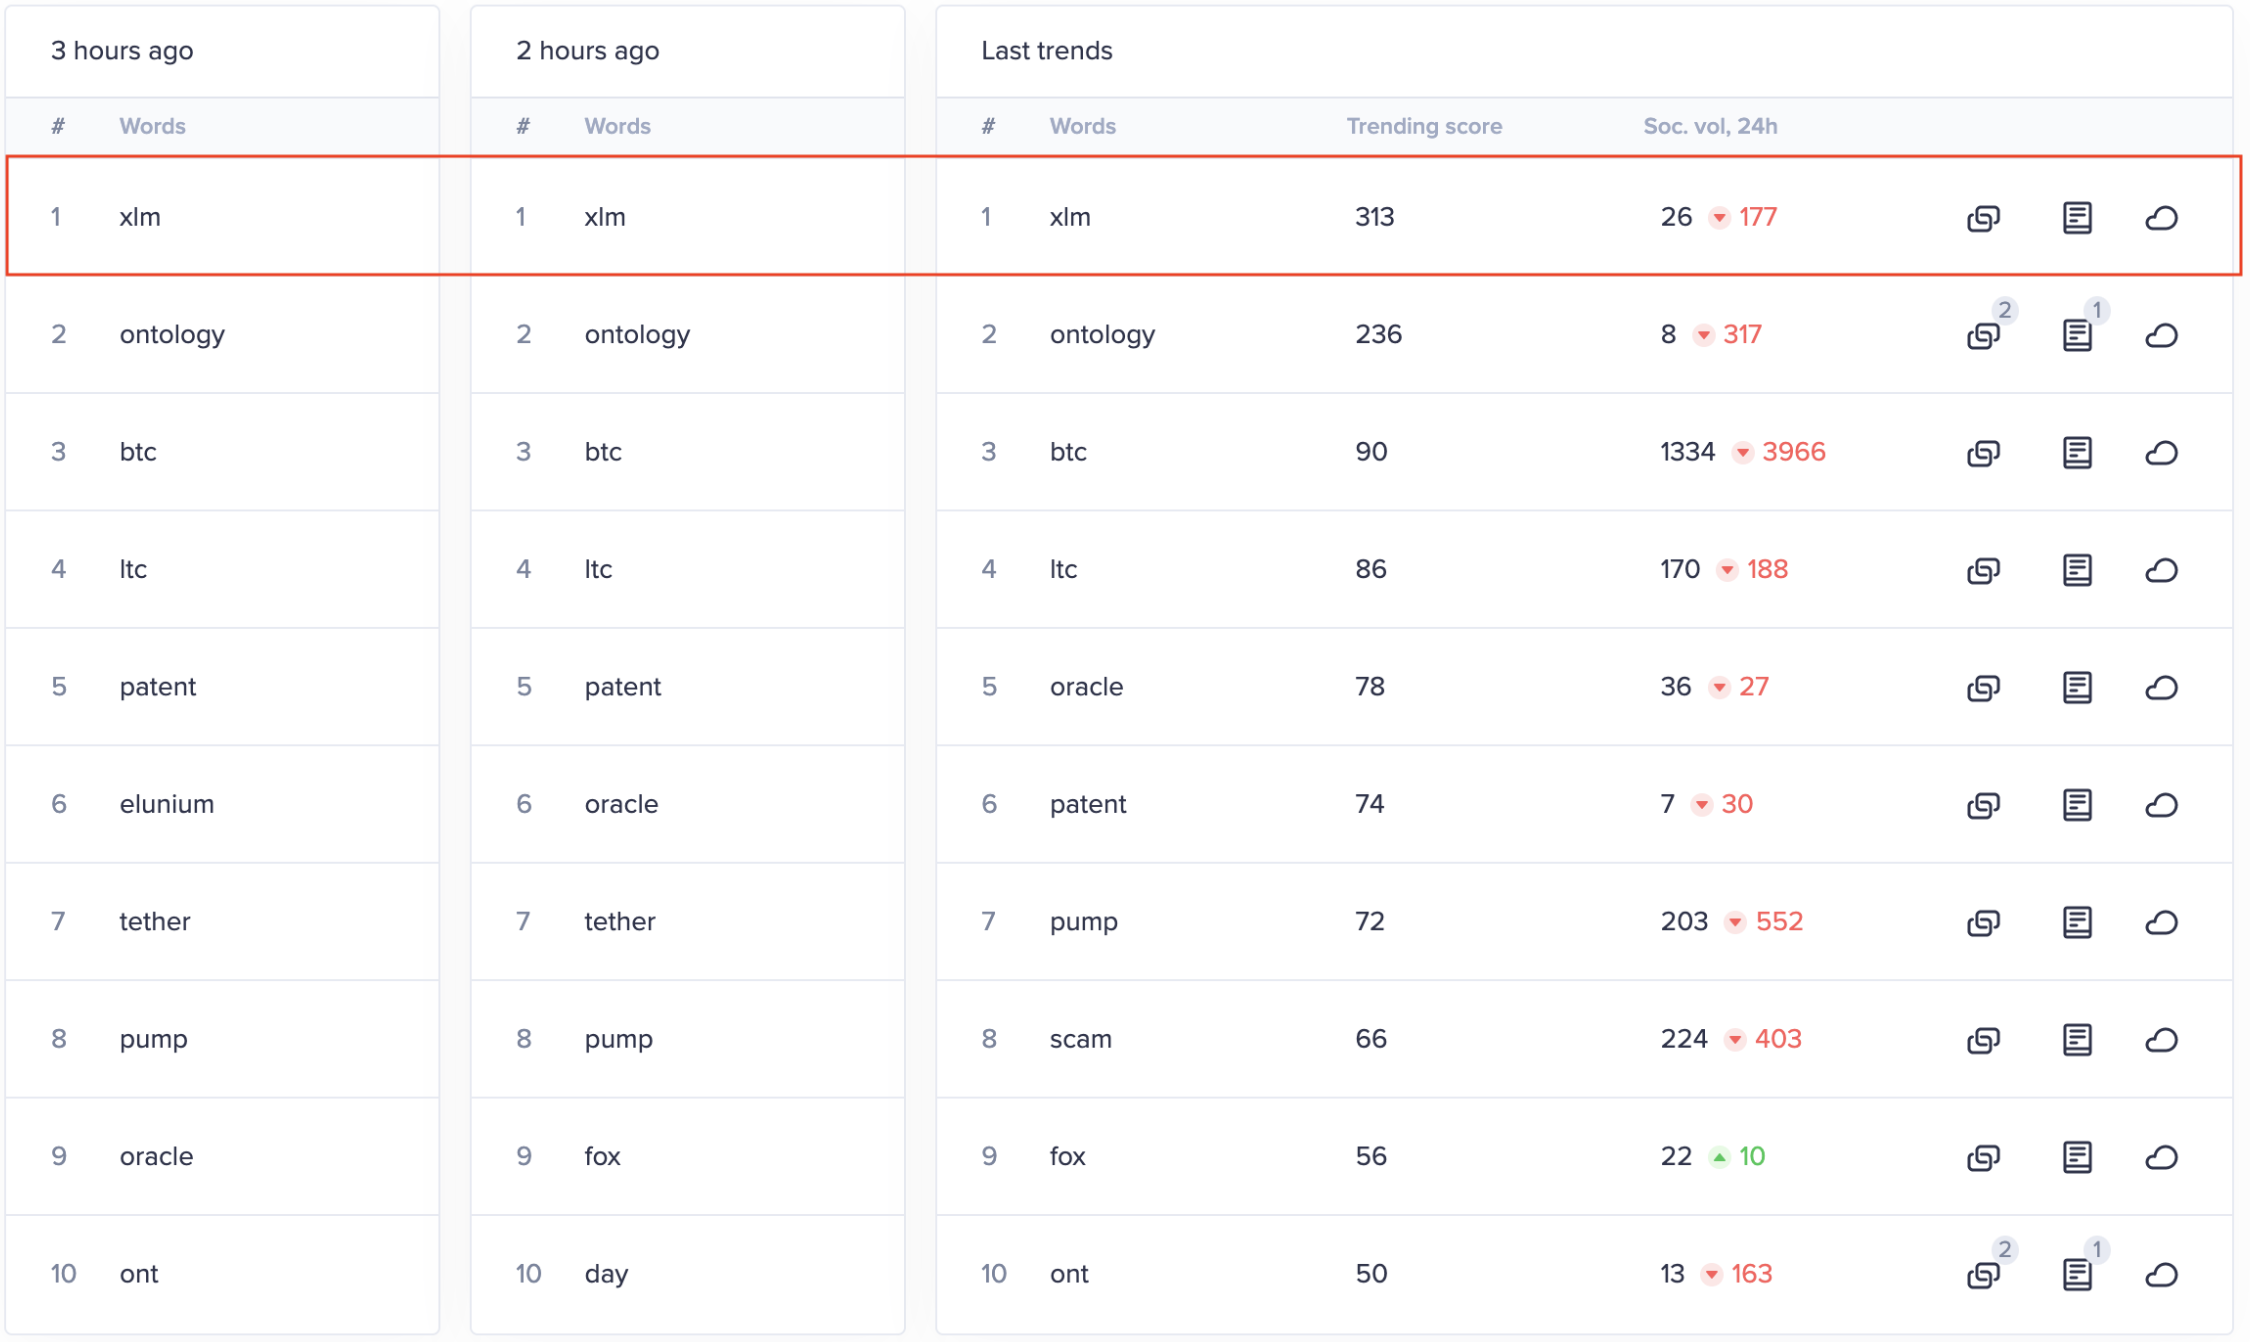
Santiment recently affirmed that Stellar Lumens popped up as the number one topic in its emerging trends index. The rise in the rankings was caused by an increase in conversations about XLM across multiple social media platforms.
The cryptocurrency insights provider highlighted that rising to the number one spot usually signals an upcoming drop in price or proximity to a “local top.”

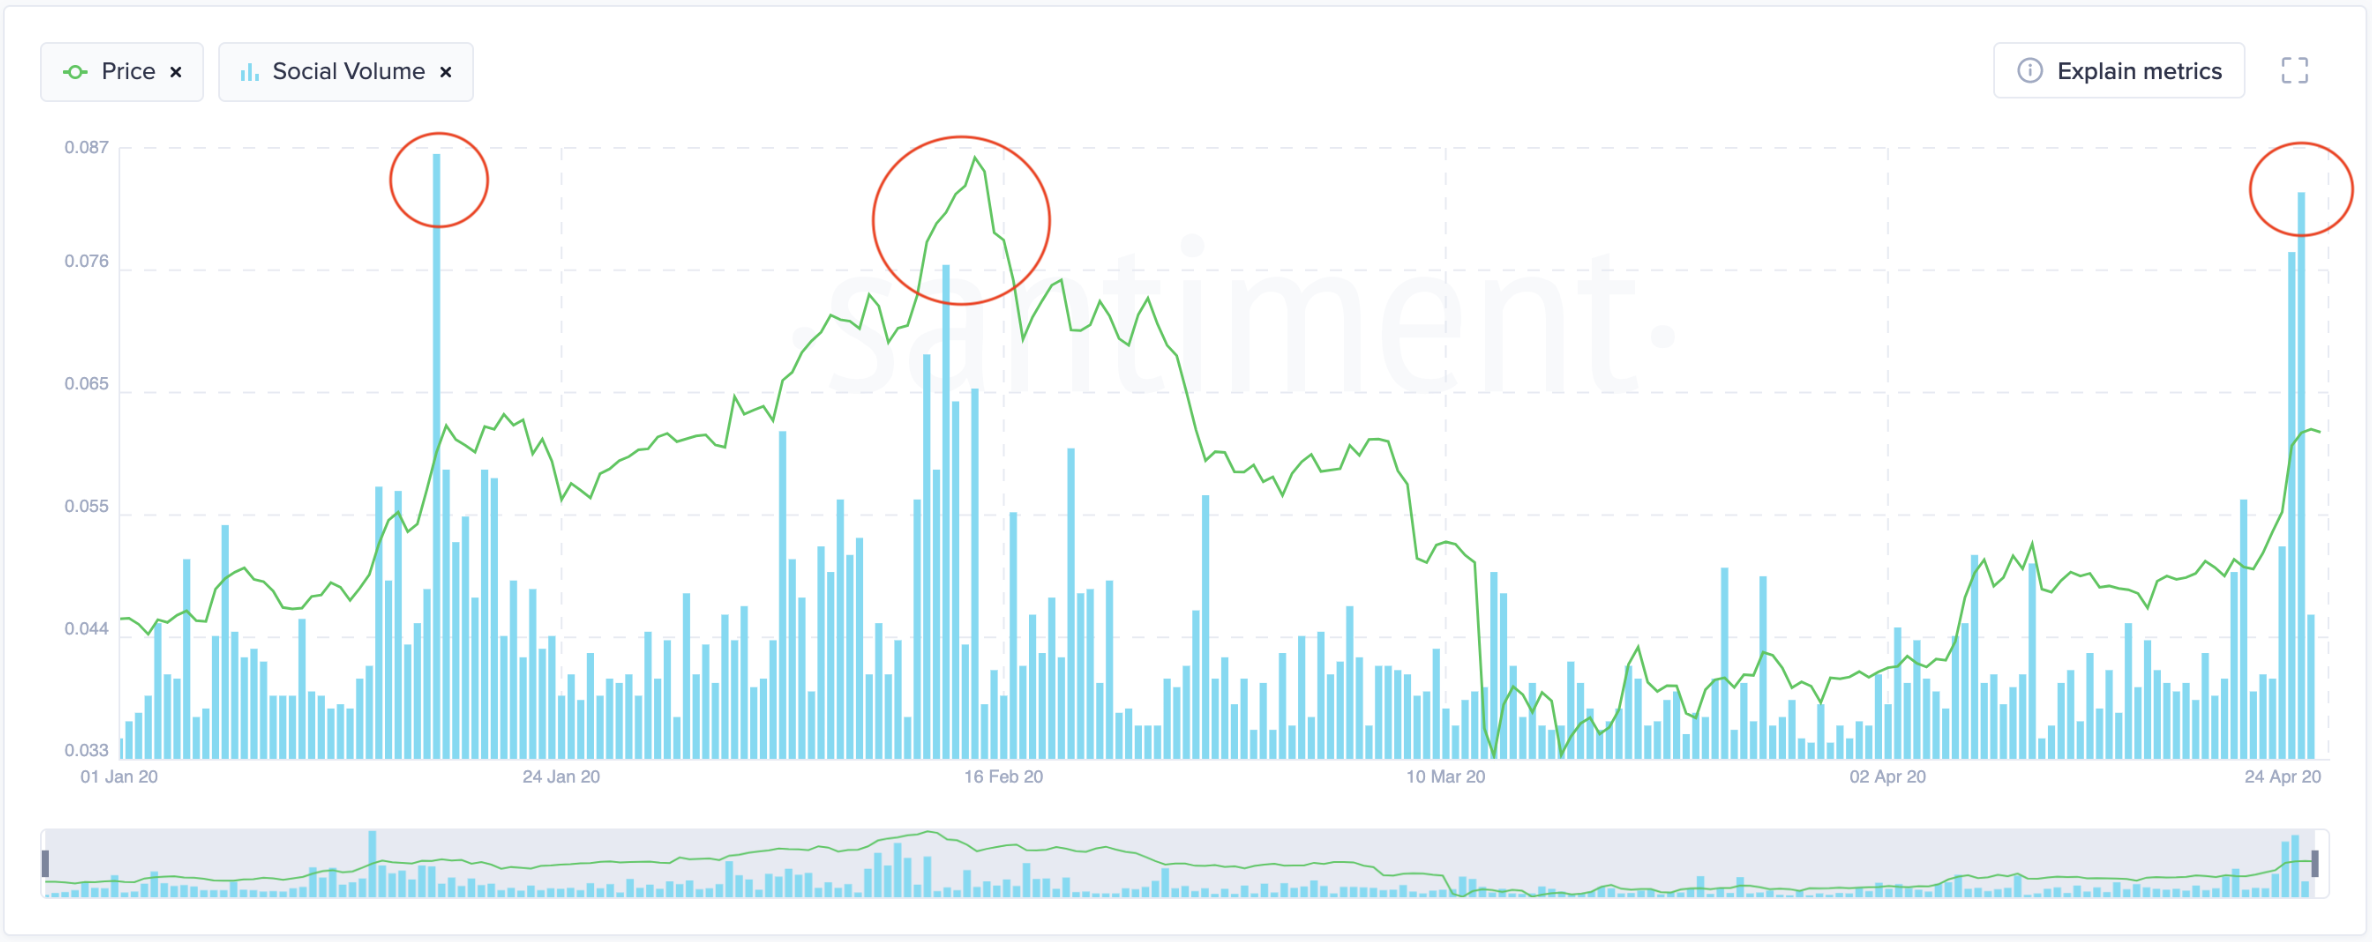
The bearish outlook aligns with Santiment’s Social Volume metric, which has been able to nail XLM’s tops over the last three months. The recent price increase to $0.067 was accompanied with a large spike in “social chatter,” which is a negative sign.
“During each of these spikes, we can observe the crowd losing interest as Social Volume starts to drop drastically, and price starts to fall soon after—possibly signalling a lack of new speculators to prop up the price,” said Santiment.

Coincidentally, the TD sequential indicator is also presenting a sell signal on Stellar’s 1-day chart. The bearish formation developed as a green nine candlestick. As mentioned before, this technical index forecasts a one to four daily candlesticks correction before the bullish trend resumes.
The last time the TD setup provided this type of sell signal, XLM dropped over 15%.
An increase in supply may have the ability to validate all the bearish signals previously explained.
If so, Lumens could go down to try to find support around the 23.6% or 38.2% Fibonacci retracement levels. These support walls sit at $0.57 and $0.51, respectively.
Paying devil’s advocate, one could argue that an increase in demand may put the bearish outlook in jeopardy. Under such circumstances, if Stellar rises above the recent high of $0.067 it might have a chance to climb towards the setup trendline, or even the 127.2% Fibonacci retracement level.
These resistance levels sit around $0.073 and $0.078, respectively.
Overall Crypto Sentiment
The crypto community appears to be growing optimistic as Bitcoin’s halving approaches. Generally, this event brings a massive inflow of capital into the market while speculation mounts.
Since most altcoins are highly correlated to the flagship cryptocurrency, they all tend to rally in anticipation of the block rewards reduction event. And right around it, the market-makers go ballistic pushing prices up to then dump their holdings on unaware investors.
In just 17 days similar market behavior could develop. Given the recent bullish impulse, it seems that excitement is already building.
Those unfamiliar with how market manipulators work should read the infamous “Pump and Dump Manifesto.” Having an understanding of the actors involved in the markets could help an active trader avoid a blowup. But, only time will tell whether history will repeat itself as the charts foretell.
Share this article
