Theta Price Analysis THETA / USD: Beware Of Greeks
Theta has failed to take advantage of the market, with the correction plunging it below its moving averages.

Share this article
- Theta has a bearish short-term outlook, with the cryptocurrency falling below its 200-period moving average on the four-hour time frame
- The four-hour and daily time frames both show large bearish patterns
- The medium-term outlook for Theta is neutral, with the cryptocurrency now testing back towards its 200-day moving average
Theta / USD Short-term price analysis
Theta has turned bearish over the short-term, with the cryptocurrency falling below its 200-period moving average on the four-hour time frame.
The four-hour time frame is showing that a bearish head and shoulders pattern has now formed, with the THETA / USD pair trading close to the neckline of the bearish pattern.
Technical indicators on the four-hour time frame have turned lower and continue to issue sell signals.
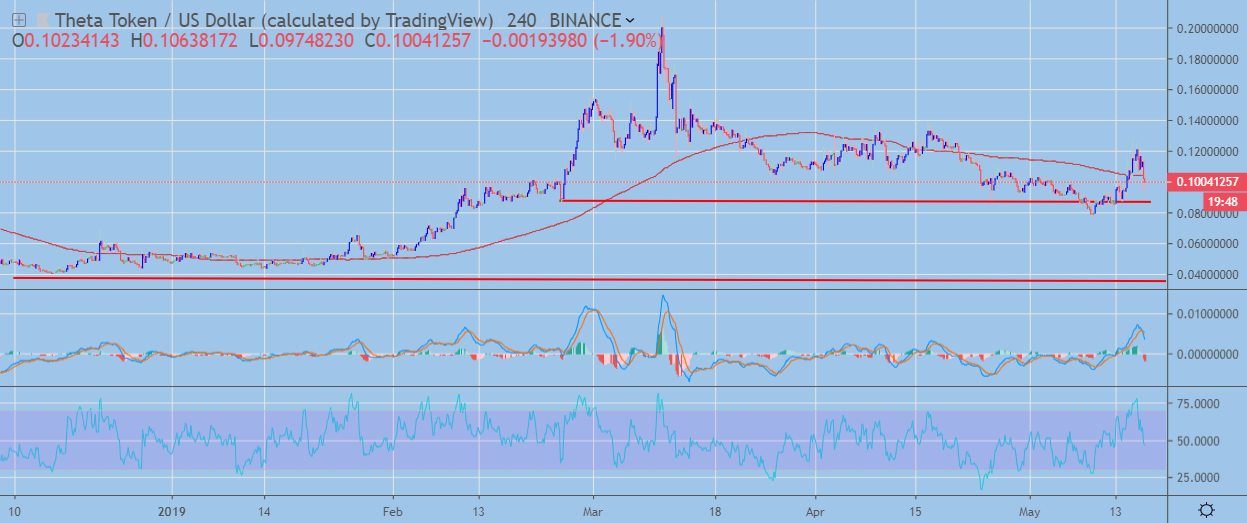 THETA / USD H4 Chart by TradingView
Pattern Watch
Traders should note that a much larger head and shoulders pattern will form across the four-hour time frame if the bearish head and shoulders pattern is triggered.
Relative Strength Index
The RSI Indicator on the four-hour time frame has turned bearish and has scope to turn much lower.
MACD Indicator
The MACD indicator has turned bearish on the four-hour time frame and is currently issuing a sell signal.
Theta / USD Medium-term price analysis
THETA has a neutral medium-term outlook, with the cryptocurrency testing back towards its key 200-day moving average.
The daily time frame is also showing a bearish head and shoulders pattern that has the potential to develop into a much larger second pattern.
Technical indicators on the daily time frame are conflicted and failing to generate a clear trading signal.
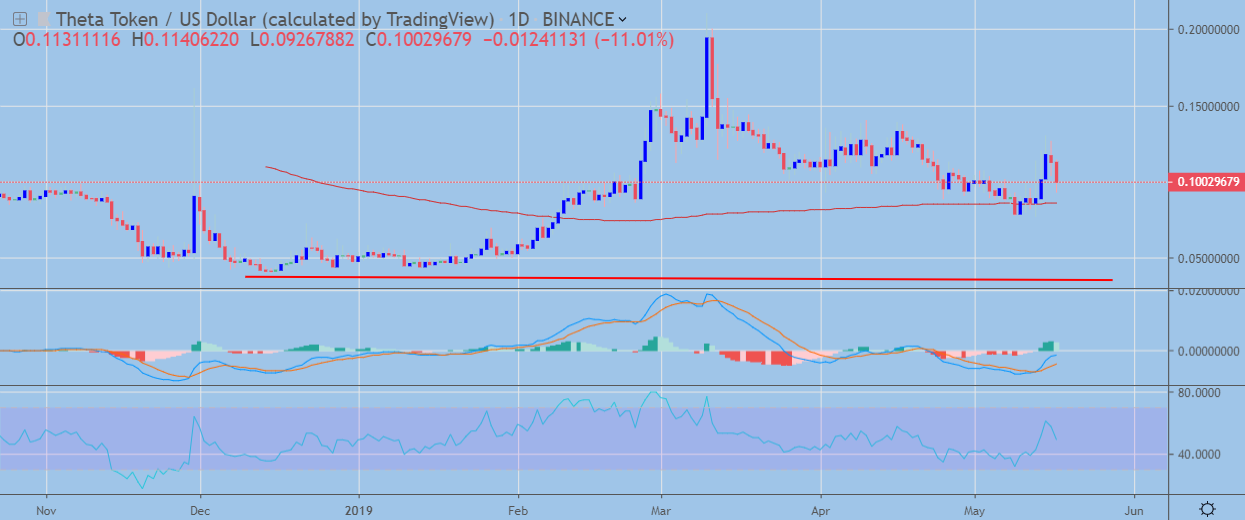 THETA / USD Daily Chart by TradingView
Pattern Watch
Traders should note that the THETA / USD pair’s 200-day moving average is currently converging with the neckline of the bearish pattern on the daily time frame.
Relative Strength Index
The Relative Strength Index on the daily time frame is correcting lower as medium-term bearish pressure builds.
MACD Indicator
The MACD indicator on the daily time frame is conflicted, with the MACD signal issuing a buy signal while the MACD histogram is trending lower.
Conclusion
Theta appears increasingly unstable over the short and medium-term, with multiple bearish head and shoulders patterns taking shape.
A bearish breakdown below the THETA / USD pair’s 200-day moving average is likely to be the trigger for further weakness in the cryptocurrency.
And yes, there are nine Greeks bearing gifts in this image. We clearly have nothing better to do with our time than Google Greek numerals – where Theta means nine. Although oddly it’s the eighth letter of the Greek alphabet. IOTA is the ninth. Also, managing to get the Parthenon into consecutive posts is a new record.
Share this article
