 Earn with Nexo

Theta Price Analysis THETA / USD: Binance Bump
Theta had a strong surge following the announcement of the listing of its secondary token on Binance.
- Theta has a bullish short-term outlook, with the cryptocurrency moving to a new monthly trading high
- The four-hour time frame now shows a bullish inverted head and shoulders pattern
- The daily time frame continues to show a valid bearish head and shoulders pattern
Theta / USD Short-term price analysis
Theta has a bullish short-term trading outlook, with the cryptocurrency advancing to a new monthly high.
The four-hour time frame shows that a bullish inverted head and shoulders pattern has now formed, with the THETA / USD pair trading close to the neckline of the bullish pattern.
Technical indicators on the four-hour time frame have turned bullish and continue to issue buy signals.
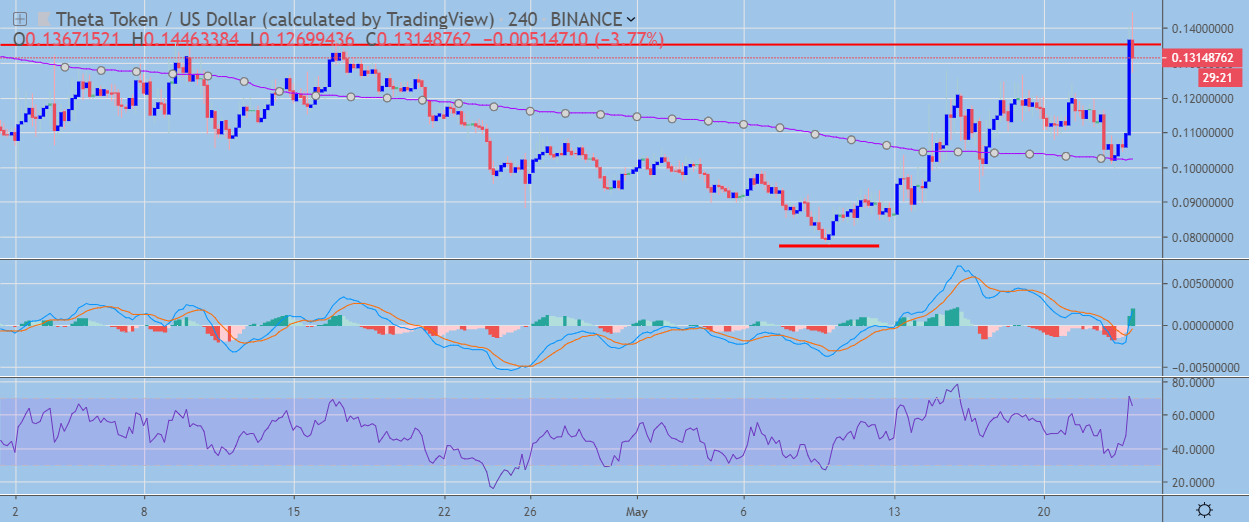 THETA / USD H4 Chart by TradingView
Pattern Watch
Traders should note that the upside target of the bullish inverted head and shoulders pattern on the four-hour time frame would take the THETA / USD pair to a new all-time trading high.
Relative Strength Index
The RSI Indicator on the four-hour time frame is bullish, although it is starting to correct lower.
MACD Indicator
The MACD indicator has turned bullish on the four-hour time frame and is currently issuing a buy signal.
Fundamental Analysis
Theta has surged after the announcement that its operational token Theta Fuel (TFuel) will be listed on Binance. TFuel is a second token in the Theta protocol that works in conjunction with the Theta token that exists today.
Theta / USD Medium-term price analysis
Theta has a bullish medium-term outlook, with the cryptocurrency trading well above its trend-defining 200-day moving average.
The daily time frame is showing that a large head and shoulders pattern remains valid, with Theta bulls working hard to negate it.
Technical indicators on the daily time frame are bullish and continue to issue a buy signal.
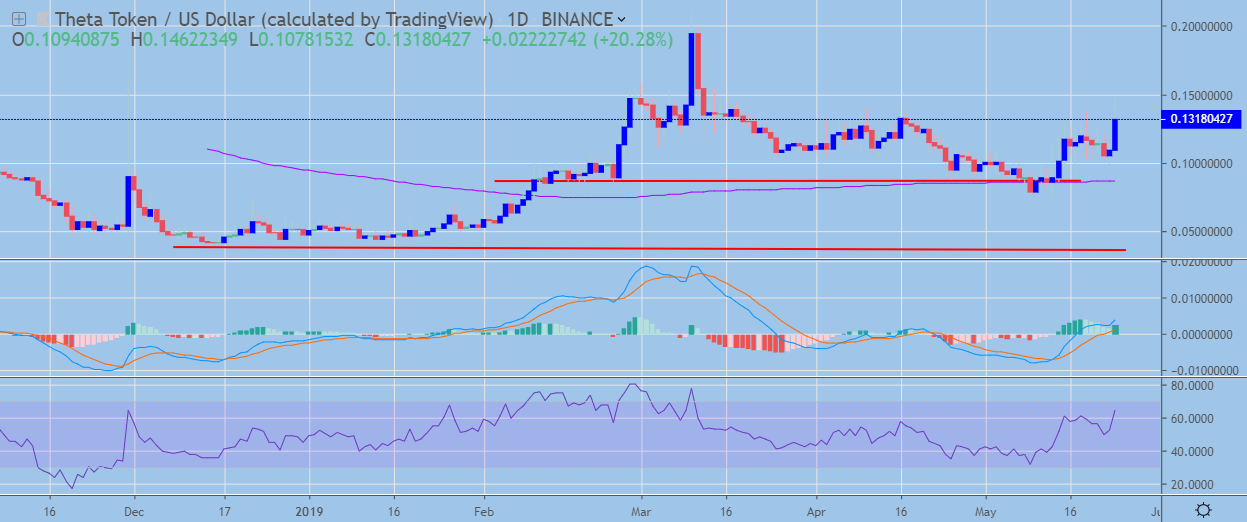 THETA / USD Daily Chart by TradingView
Pattern Watch
Traders should note that if the bearish pattern on the daily time frame is invalidated then a large bullish pattern will start to take shape.
Relative Strength Index
The Relative Strength indicator on the daily time frame is bullish and shows scope for further upside.
MACD Indicator
The MACD indicator on the daily time frame is bullish, with both the MACD signal line and histogram issuing buy signals.
Fundamental Analysis
In the medium term, Theta looks interesting. The project has closed a strategic funding round led by Samsung NEXT and Blockchain.info and is now fully funded through 2021. The team is planning to open offices in Seoul, Singapore and London and invest globally in media partner adoption.
Conclusion
The recent move higher in the THETA / USD pair has helped to create a large bullish pattern on the four-hour time frame. If buyers can maintain the positive momentum and negate the bearish pattern on the daily time frame, the cryptocurrency could soar to a new all-time trading high.