Theta Price Analysis: Expecting Gains
Technicals show strong breakout potential.

Share this article
- Theta has a bullish short-term and medium-term trading outlook
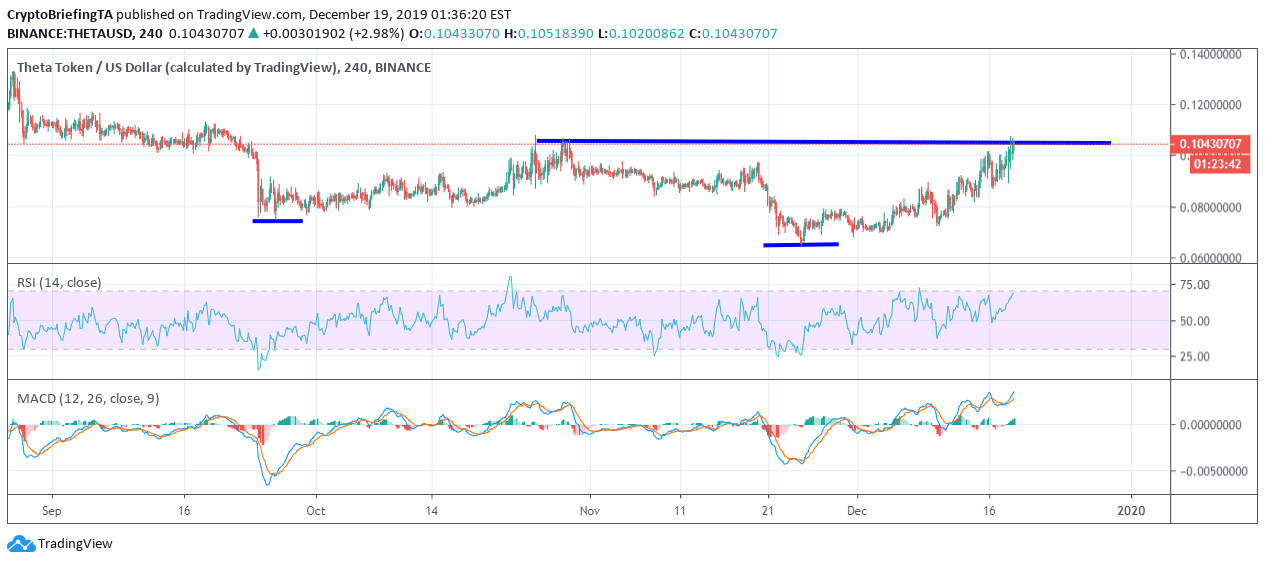
- The four-hour time frame shows that a bullish inverted head and shoulders pattern may be forming
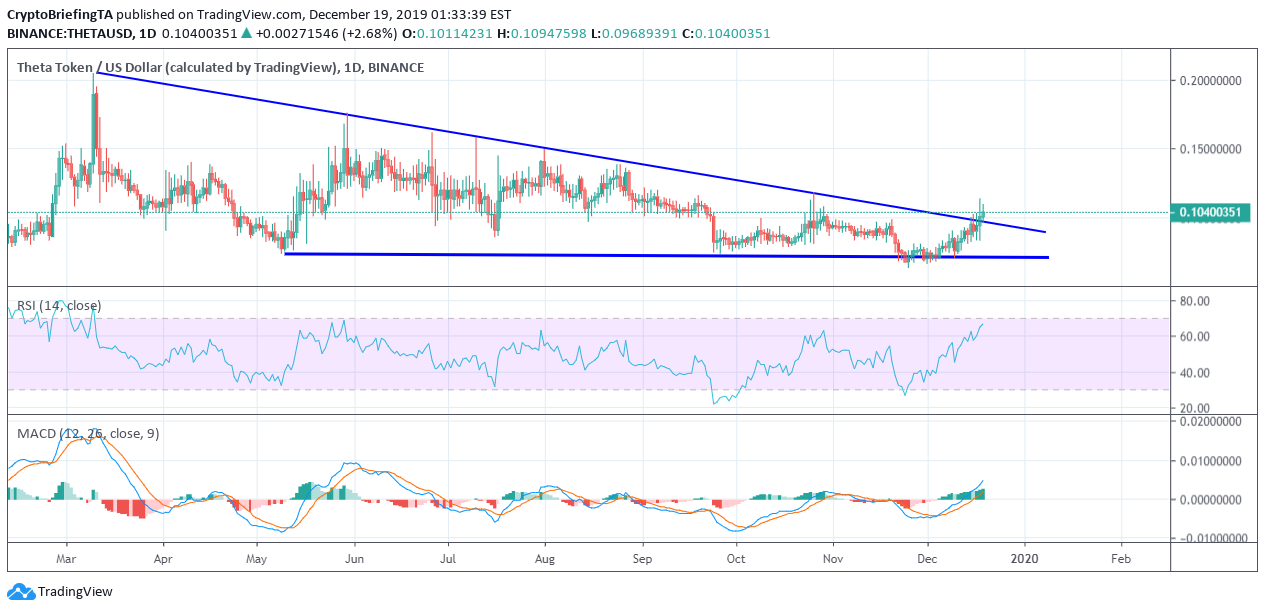
- The daily time frame continues to shows that a bullish wedge pattern breakout has occurred
Theta has recently been on the rise and posting impressive trading gains, trading counter to the cryptocurrency market sell-off. Technical analysis suggests further upside may be on the horizon for THETA/USD.
THETA/USD has gained over 20 percent in value since the start of the trading week and trades higher by around 50 percent since the start of December.
Over the summer Theta failed to rally, provoking medium and long-term sellers to take back control of the cryptocurrency.
The technicals are now improving and show significant upside potential over both the short and medium-term, which could see the THETA/USD pair rallying back towards the best levels of 2019.
The four-hour time frame shows that an inverted head and shoulders has started to form with strong upside potential. The size of the pattern points to gains towards the $0.015 level at a minimum.
Traders should be mindful that the bullish reversal pattern is now in play. Price is trading above neckline support, just above the $0.010 level.
The daily time frame shows that a wedge pattern breakout has occurred, with price breaking above a falling wedge pattern that has been in play since March.
According to the size of the wedge breakout, the cryptocurrency could rally towards the $0.020 level if the full upside potential of the pattern breakout is achieved.
Looking at key technical indicators, Theta is trading above all major moving averages and is also supported by a strong buy signal on the MACD indicator on the higher time frames, further confirming the overall bullish bias.
Upside Potential
The four-hour time frame shows that key technical resistance is now located at the $0.11 and $0.15 levels.
Key technical resistance over the medium-term is located at the $0.18 and $0.20 levels.
Downside Potential
The four-hour time frame is showing that the THETA/USD pair has strong long-term technical support around the $0.090 and $0.085 levels.
Sustained weakness under the $0.065 level should be considered extremely bearish for Theta.
Summary
Theta continues its recent rise and continues to be an emerging cryptocurrency that traders should be monitoring carefully.
The technicals surrounding the THETA/USD pair look increasingly bullish while the token trades above $0.10.
Share this article
