
Only a Thin Support Keeps Ether From Catastrophe
The price of Ether at current weighs heavily on a single line of defense. If crossed, it could spell catastrophe for the second largest digital asset by market cap.
Investors are paying close attention to Ether’s price action since it is currently testing a significant support level that would likely determine where it is headed next.
Ethereum Teeters from Catastrophe
In the last 36 hours, Ethereum went through a massive sell-off that saw its price plummet over 50%.
The smart contracts giant went from trading at a high of $196.5 to hit a low of $90. This price level has not been seen since December 2018.
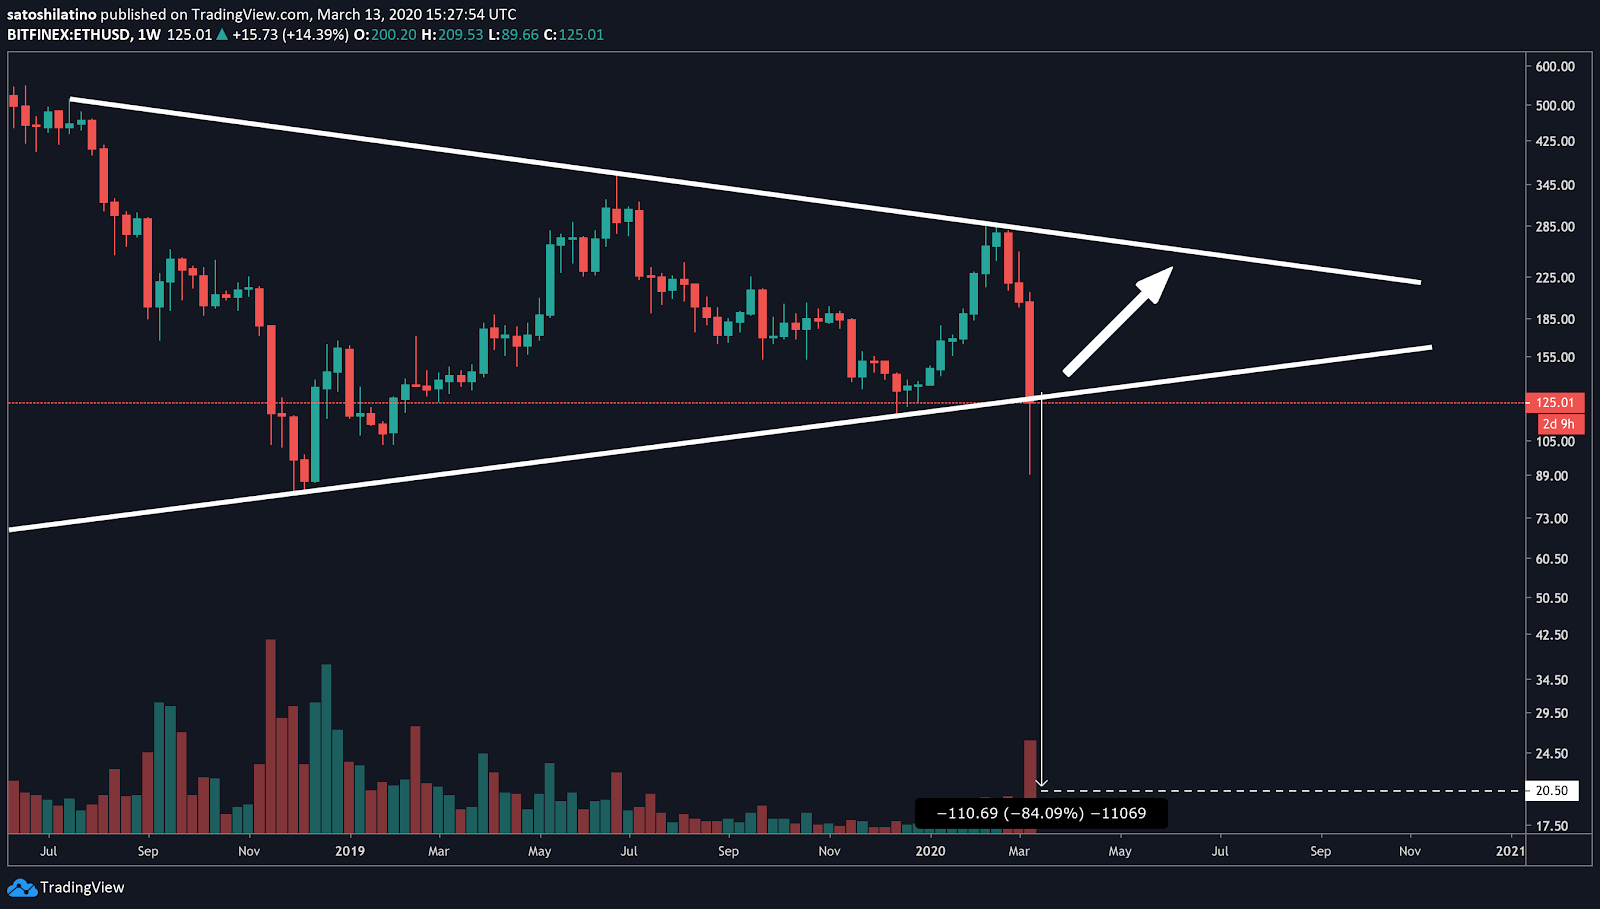
The drastic downturn in Ether’s price sent investors into “extreme fear,” according to the Crypto Fear and Greed Index. It appears that market participants are fearful of the probability that ETH could be breaking out in a downward direction of a multi-year symmetrical triangle that has been developing on its 1-week chart.
This technical formation is indicative of a consolidation period where the price of an asset is contained within two converging trend lines. By measuring the distance between the initial high and low of the pattern, the symmetrical triangle estimates an 84% target upon the breakout point.
As it can be seen on the weekly chart, Ether seems to have breached the lower trendline of the symmetrical triangle. The downward move could trigger a full-blown trend reversal from bullish to bearish taking Ethereum to $20.5.

Nevertheless, not all investors were scared by ETH’s price action. IntoTheBlock’s “In/Out of the Money Around Current Price” model estimates that nearly 6.9 million Ether were bought by over 330,000 addresses at an average price of $117.5.

The substantial buying pressure during the recent price drop allowed Ethereum to move back inside the symmetrical triangle where it has been consolidating since July 2018.
A further increase in demand from the current price levels could allow ETH to bounce off the lower trendline of the symmetrical triangle to the upper trendline.
Meanwhile, a weekly candlestick close below the lower trendline could validate the catastrophic scenario that many market participants have been anticipating.
Now, it is just a matter of time before the beginning of a new weekly candlestick open, which could be the catalyst for Ether’s next major price movement.