
Traders Beware: Bitcoin Jump to $12K a “Fakeout,” BTC May See Further Losses
Bitcoin is back below $12,000 without providing a clear path for the direction of its trend.
Long-time Bitcoin holders have taken advantage of the recent bullish price action to realize profits. Now that prices have retraced, data suggests that further losses are on the way.
Bitcoin Goes Through High Volatility
On Aug. 17, the flagship cryptocurrency appeared to have broken out of an ascending triangle.
This technical pattern formed as a direct result of Bitcoin’s price movement that began this month. Moving past the $12,000 hurdle suggested that BTC was bound to advance towards the $14,000 mark.
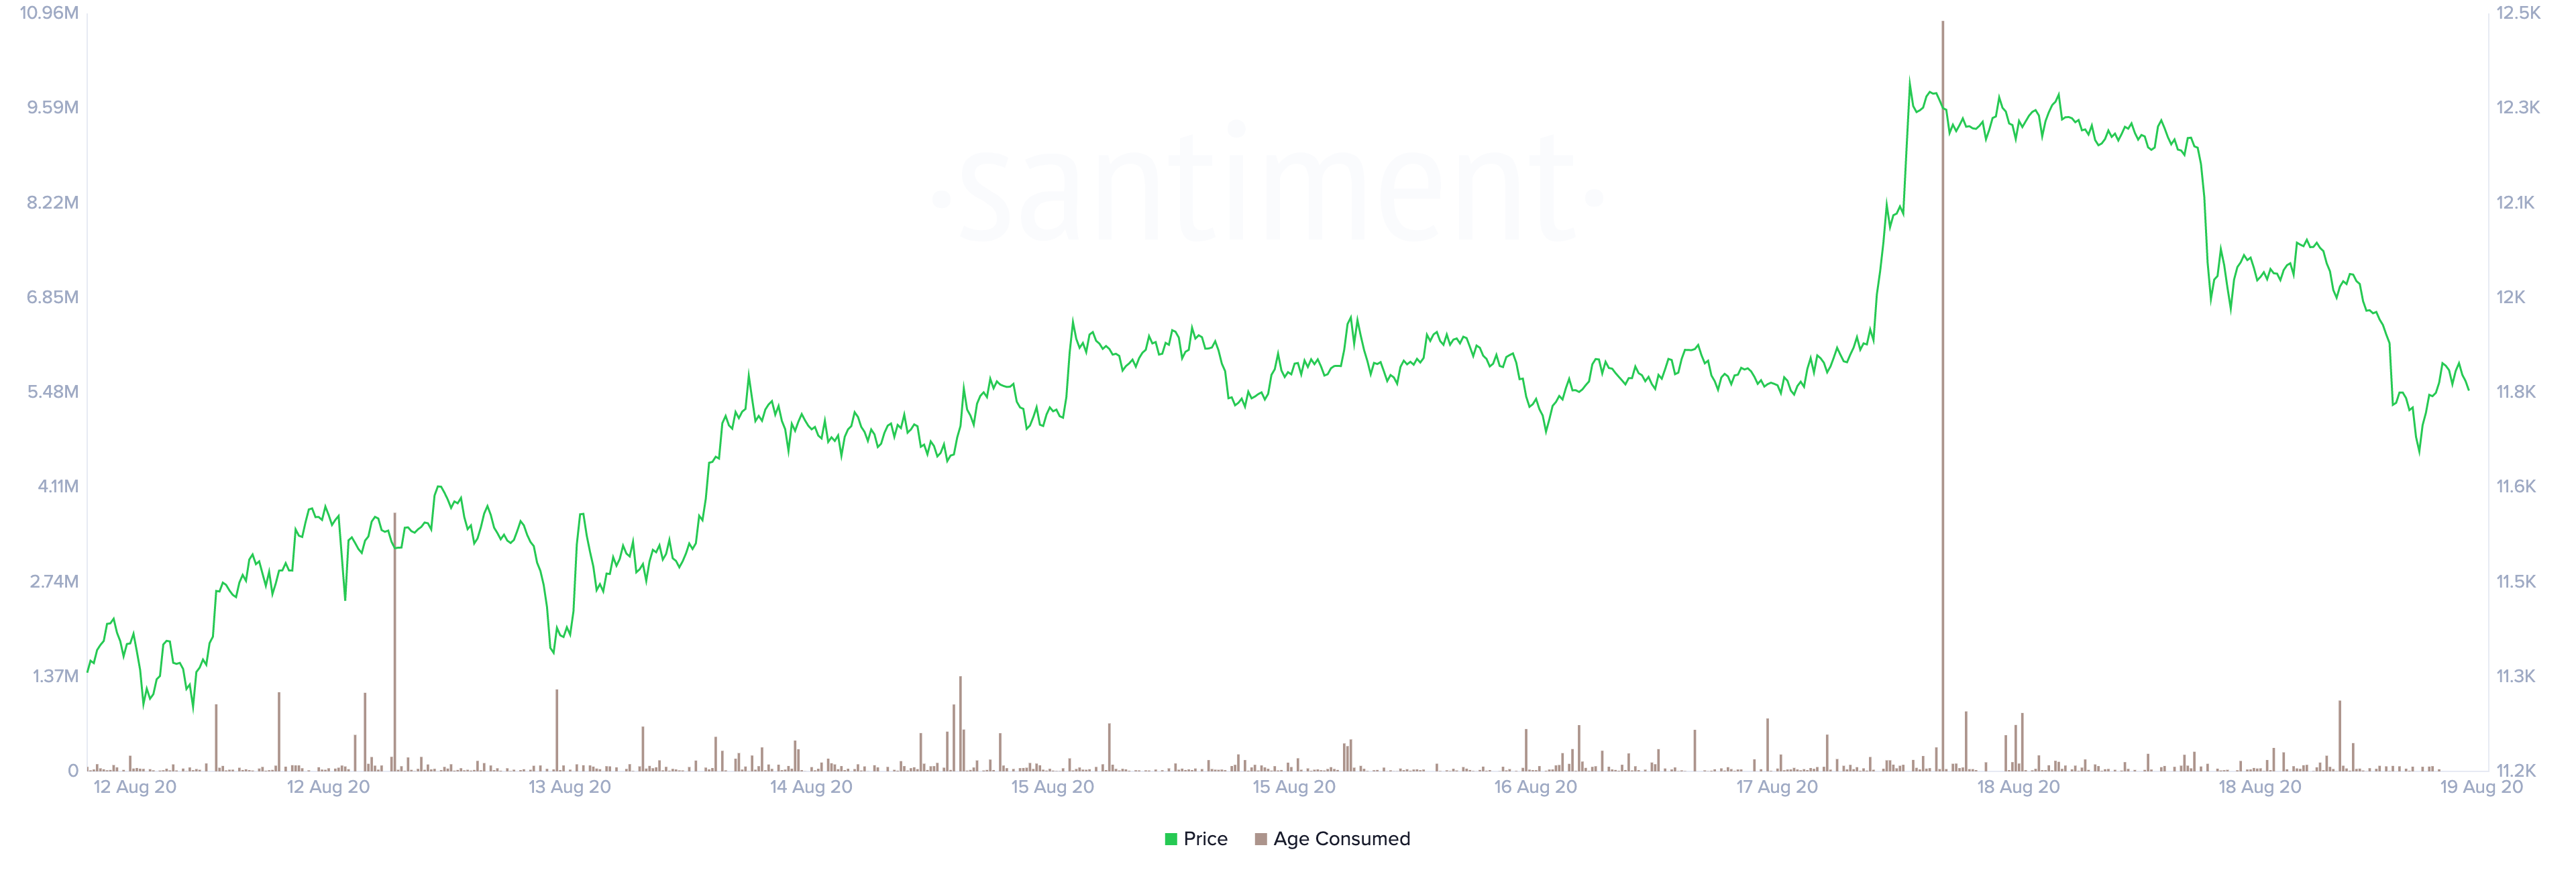
Nevertheless, the pioneer cryptocurrency was rejected by the overhead resistance and has retraced over 7% in the past two days. Santiment’s Token Age Consumed index indicates that the downward pressure was fueled by a significant number of idle BTC tokens exchanging hands.
“Spikes in ‘Token Age Consumed’ can signal changes in the behavior of some long-term holders, and tend to precede increased volatility for the coin’s price action,” affirmed Santiment.
Now, investors wonder whether the recent price action was part of a bullish fakeout and if Bitcoin is actually bound for further losses.
A Narrow Trading Range
When looking at BTC’s 9-hour chart, prices are contained within an ascending parallel channel instead of an ascending triangle. Consistent with this technical formation’s characteristics, each time Bitcoin rises to the upper boundary of the channel, it drops down to hit the lower edge. From this point, it bounces back up again.
The bellwether cryptocurrency recently moved down to the lower boundary of the channel following the rejection.
If this technical pattern holds, prices are poised to rebound. A spike in the buying pressure near the current levels might see BTC surge to $12,250 or reach a new yearly high of $12,800.
Nonetheless, it is imperative to pay close attention to a 9-hour candlestick close below the parallel channel drawn in yellow on the image above, given the significant spike in idle BTC tokens.
Slicing through this crucial barrier may trigger panic selling among investors and trigger a correction down to $11,000 or lower.
Key Supply Walls to Watch
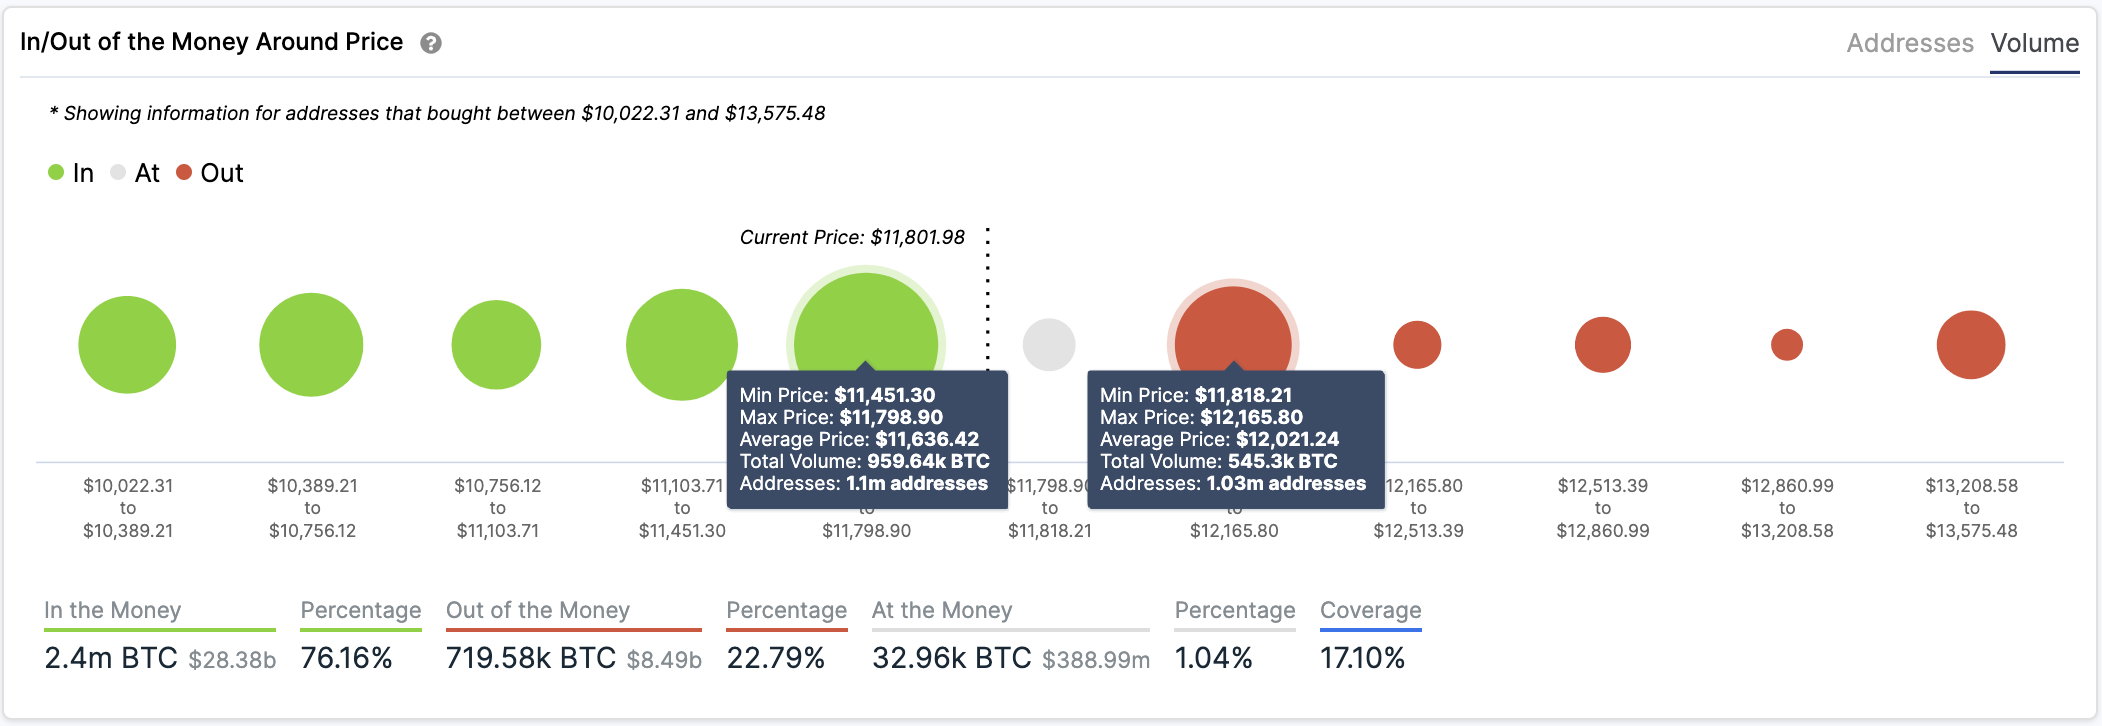
IntoTheBlock’s “In/Out of the Money Around Price” (IOMAP) model reveals that Bitcoin sits between two massive supply walls that will determine where prices are headed next.
Approximately 1.1 million addresses had previously purchased nearly 960,000 BTC between $11,450 and $11,800. Meanwhile, over 1 million addresses are holding roughly 550,000 BTC between $11,820 and 12,020.
This critical area of interest may have the ability to absorb any upward or downward pressure until one side finally gives up. Until a break of either support or resistance occurs, it is advisable to stay out of any long or short positions to avoid adverse market conditions.
Now that Bitcoin seems on the cusp of its next bullish cycle, having cash ready to deploy is a must.