
Bitcoin Hits $12,000, Ethereum and XRP Breakout
Bitcoin, Ethereum, and XRP continue trending upwards as market participants grow bullish about their future.
After Bitcoin crossed the $12,000 barrier, market enthusiasm has pulled Ethereum and XRP along for the ride. Although all data points to a further advance, these three cryptos still face critical supply barriers ahead of them.
Bitcoin Prepares for a Major Price Movement
The flagship cryptocurrency has endured a prolonged consolidation period that began on Aug. 2. While its price has made a series of higher lows since then, the $12,000 resistance level continued to reject Bitcoin from advancing further.
Such market behavior formed an ascending triangle on BTC’s 4-hour chart. A horizontal line can be drawn along with the swing highs while a rising trendline developed along with the swing lows.
A recent spike in the buying pressure behind the pioneer cryptocurrency allowed it to break above the overhead resistance. Now, it could see shoot up nearly 13% based on the ascending triangle formation.
This target is determined by measuring the distance between the two highest points of the triangle and adding it to the breakout point.
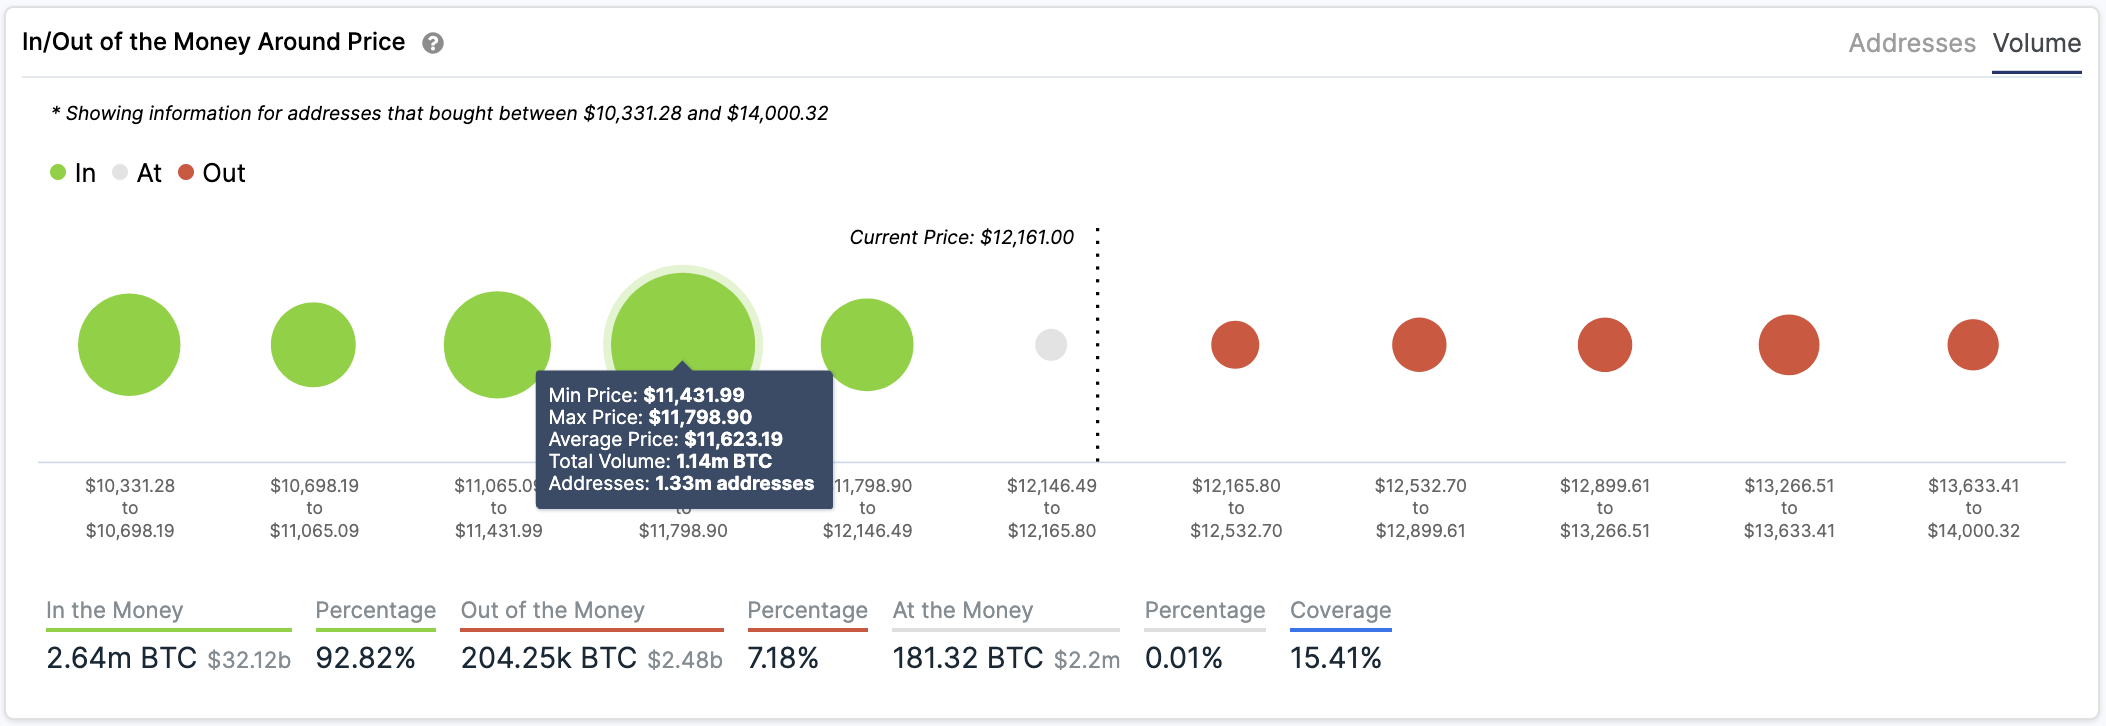
IntoTheBlock’s “In/Out of the Money Around Price” (IOMAP) model adds credence to the bullish outlook. Based on this on-chain metric, Bitcoin sits on top of a massive supply barrier that may allow the uptrend to continue.
Approximately 1.33 million addresses had previously purchased nearly 1.14 million BTC between $11,430 and $11,800.
This critical area of interest may have the ability to absorb any downward pressure as holders within this price range would likely do anything to remain profitable. They might even buy more tokens to push prices to reach higher highs.
Although the odds seem to favor the bulls on the lower time frames, the TD sequential indicator estimates that Bitcoin sits in overbought territory.
This technical index recently presented a sell signal in the form of a green nine candlestick on the 3-day chart. The bearish formation is indicative of a one to four three-day candlesticks correction before the uptrend resumes.
It is worth mentioning that the TD setup has been incredibly accurate at predicting BTC’s local tops and bottoms. It even presented a buy signal in early July, just before prices surged over 33%.
Therefore, this indicator’s current forecast must be taken seriously since a break below the $11,430 support could result in further losses.
Ethereum Faces Stiff Resistance Ahead
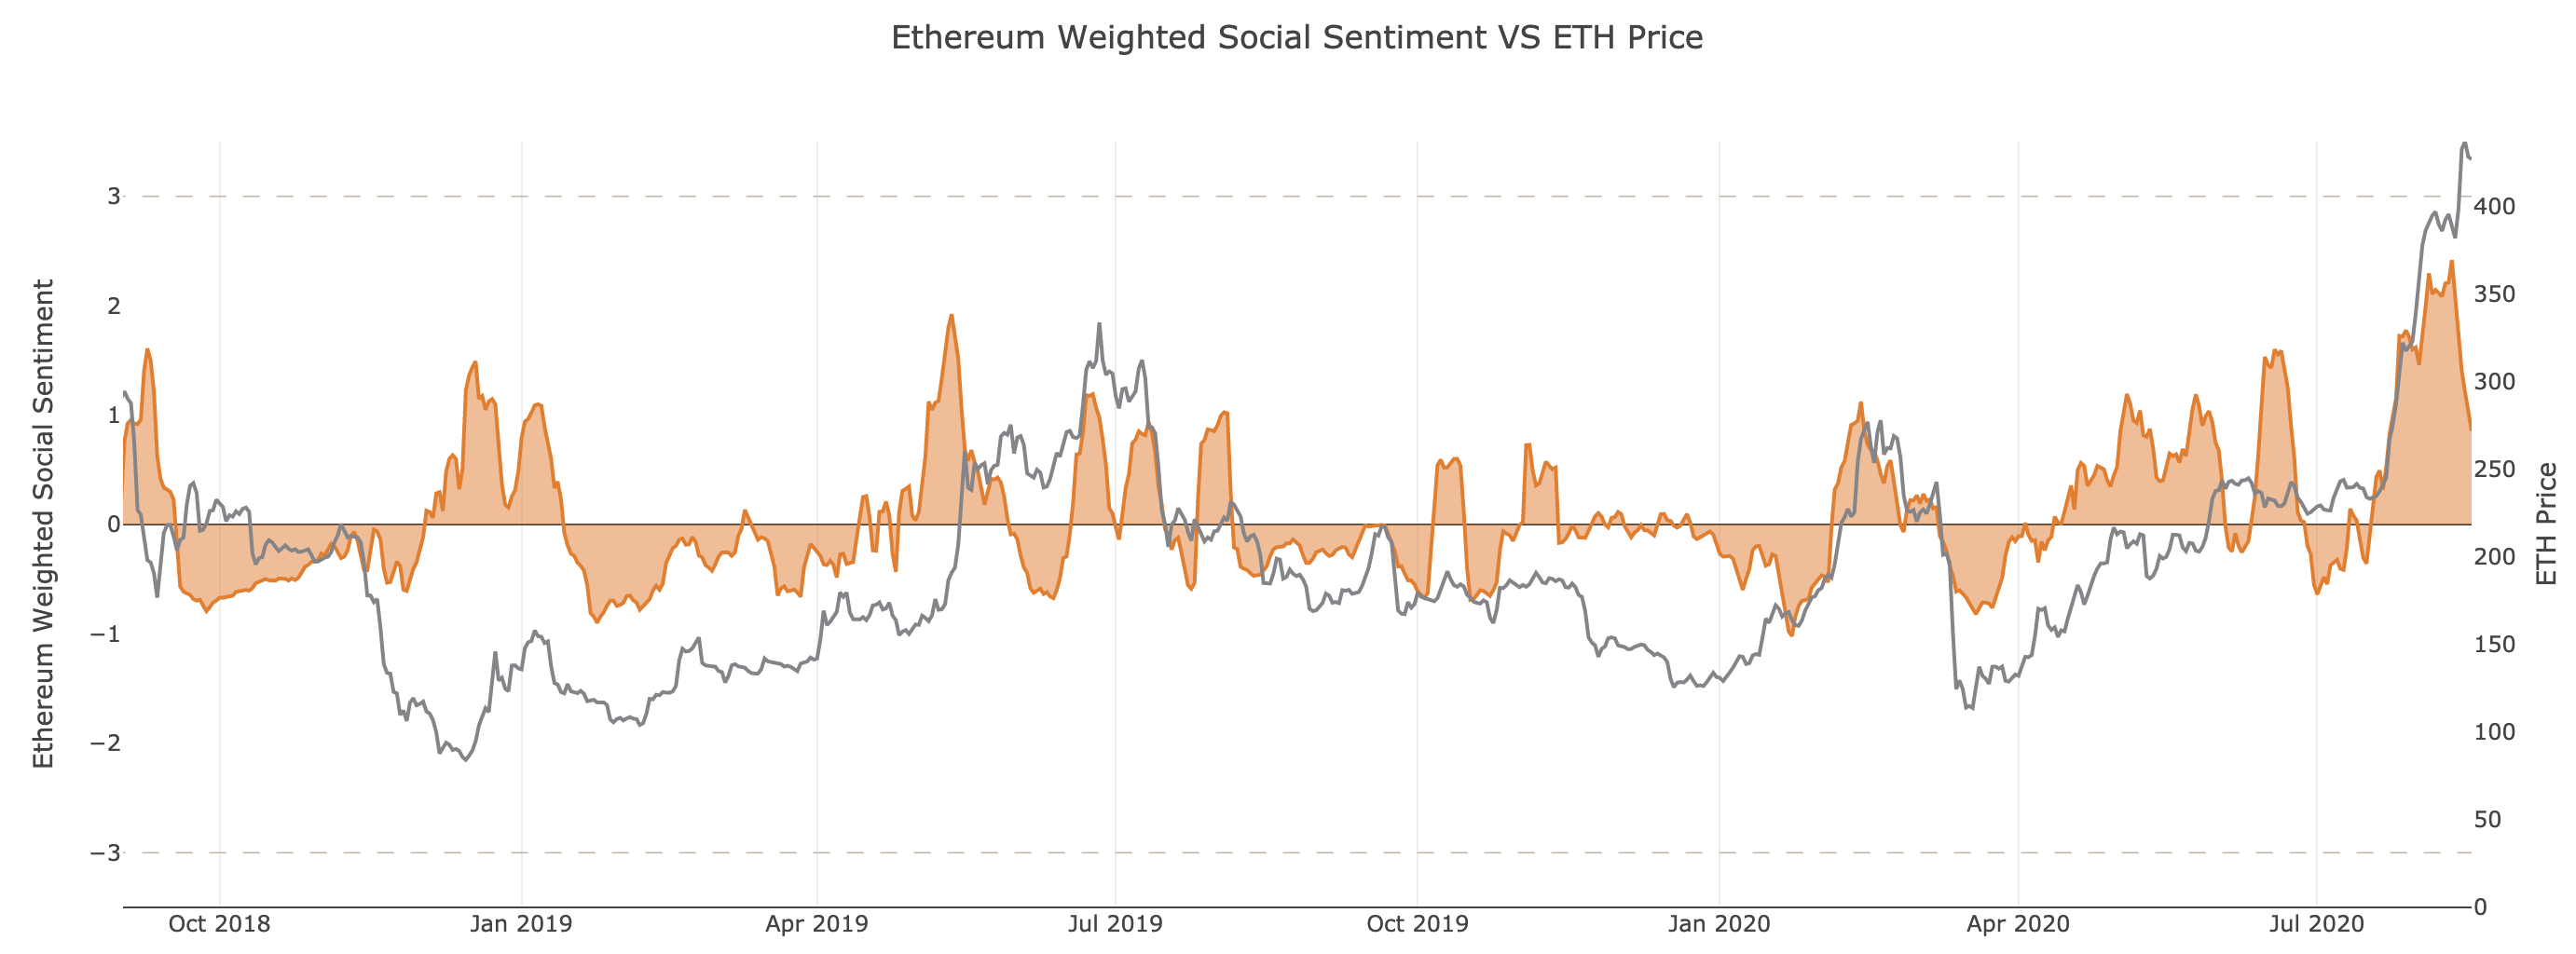
Ethereum’s social sentiment skyrocketed as speculation mounted around the Medalla testnet and the boom in DeFi tokens.
While the number of ETH-related mentions on social media went through the roof, large investors seemingly rushed to add more Ether to their portfolios. The spike in demand for the smart contracts giant was significant enough to push prices up to a new yearly high $445.7.
ETH reached this milestone alongside a new all-time high in positive social sentiment, but this is not necessarily a positive sign, according to Brian Quinlivan, marketing and social media director at Santiment.
“This is a classic case of the crypto community being simultaneously euphoric about a coin’s prospects with very few people willing to be bearish on the highly reputable project. But if history has taught us anything, buying into a euphorically viewed asset is the worst time to do so,” said Quinlivan.
The TD sequential indicator adds credence to the bearish outlook since it presented a sell signal on ETH’s 3-day chart. The bearish formation developed as a green nine candlestick, anticipating a one to four three-day candlesticks retracement.
Historical data shows that each sell signal the TD index provided since the beginning of the year has been validated and succeeded by steep price declines.
In the event of a correction, IntoTheBlock’s IOMAP model reveals there is a crucial support wall underneath Ether that could hold falling prices at bay. Based on this on-chain metric, roughly 700,000 addresses hold nearly 6.7 million ETH between $390 and $403.
Such a considerable supply barrier may have the ability to absorb some of the selling pressure. But breaking through it would likely result in a downswing towards $300.
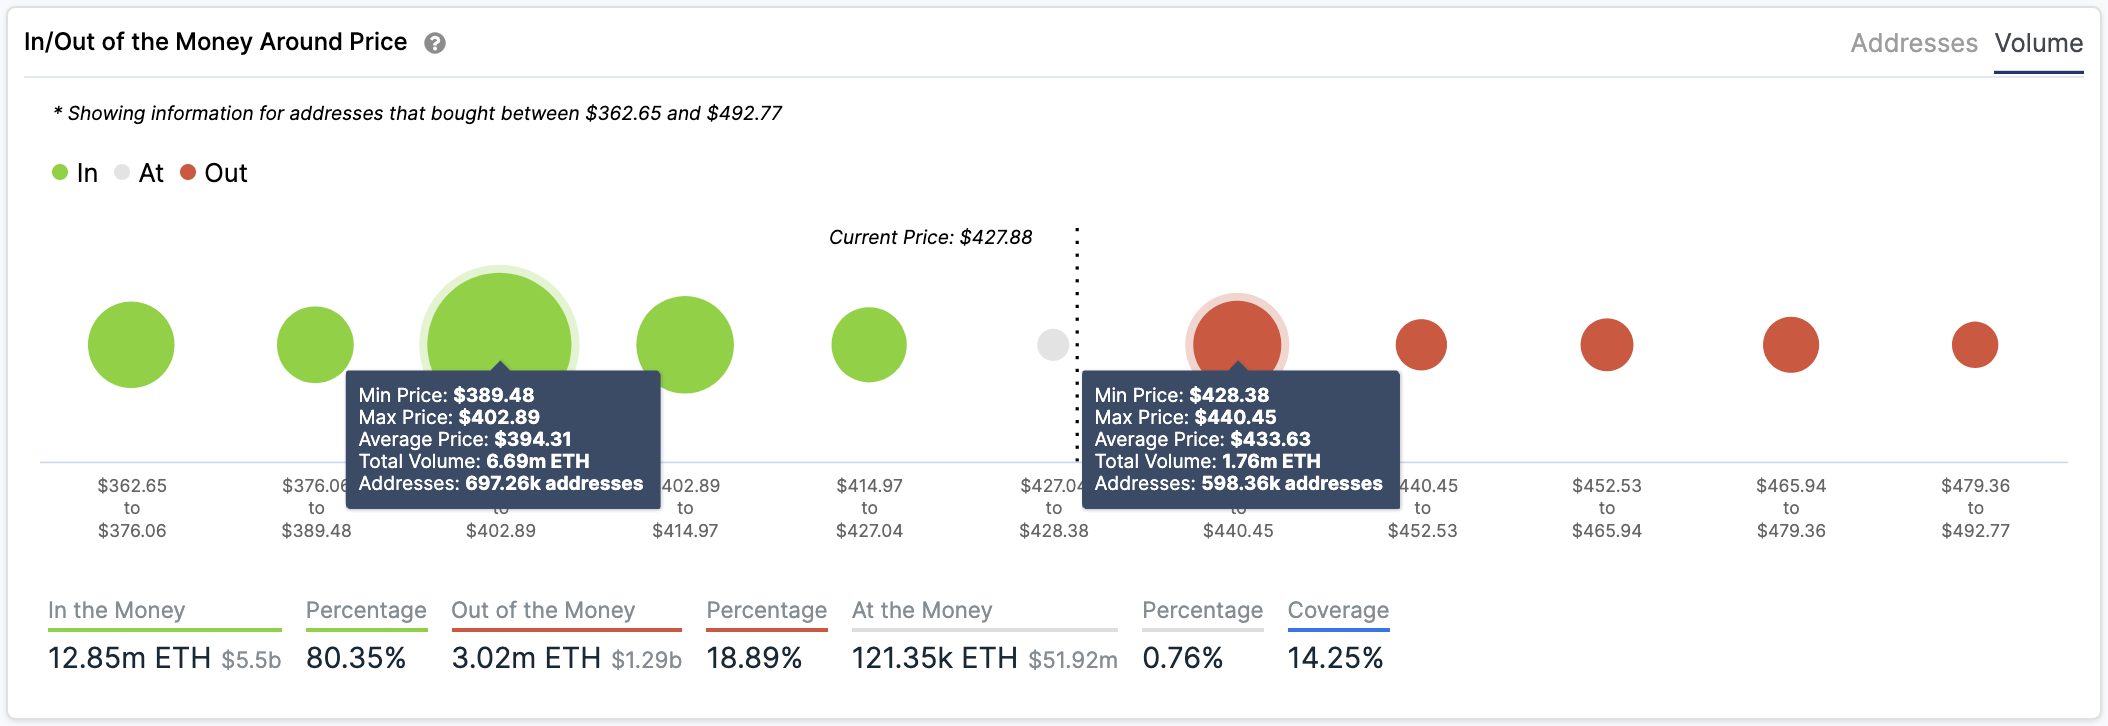
On the flip side, the IOMAP cohorts show that the most critical resistance barrier ahead of Ethereum lies between $428 and $440. Here, nearly 600,000 addresses bought 1.8 million ETH. If demand for the second-largest cryptocurrency by market cap is significant enough, it may slice through this hurdle and aim for $500.
XRP Poised to Enter New Bullish Cycle
Ripple made headlines after announcing that its business model would pivot towards expanding the utility of its native token, XRP.
CEO Brad Garlinghouse affirmed that the distributed ledger firm would aim to support activities far beyond the scoop of international remittances, just like Amazon branched out into e-commerce.
“Amazon started as a bookseller and just sold books. We happen to have started with payments. Two years from now, you’re going to find that Ripple is to payments as Amazon was to books,” affirmed Garlinghouse.
More emphasis will be placed on creating the necessary tools, services, and programs to empower developers worldwide to build their applications on top of XRP’s blockchain. Senior Vice President at Xpring Ethan Beard explained the move as shifting from “writing cheques to writing code.”
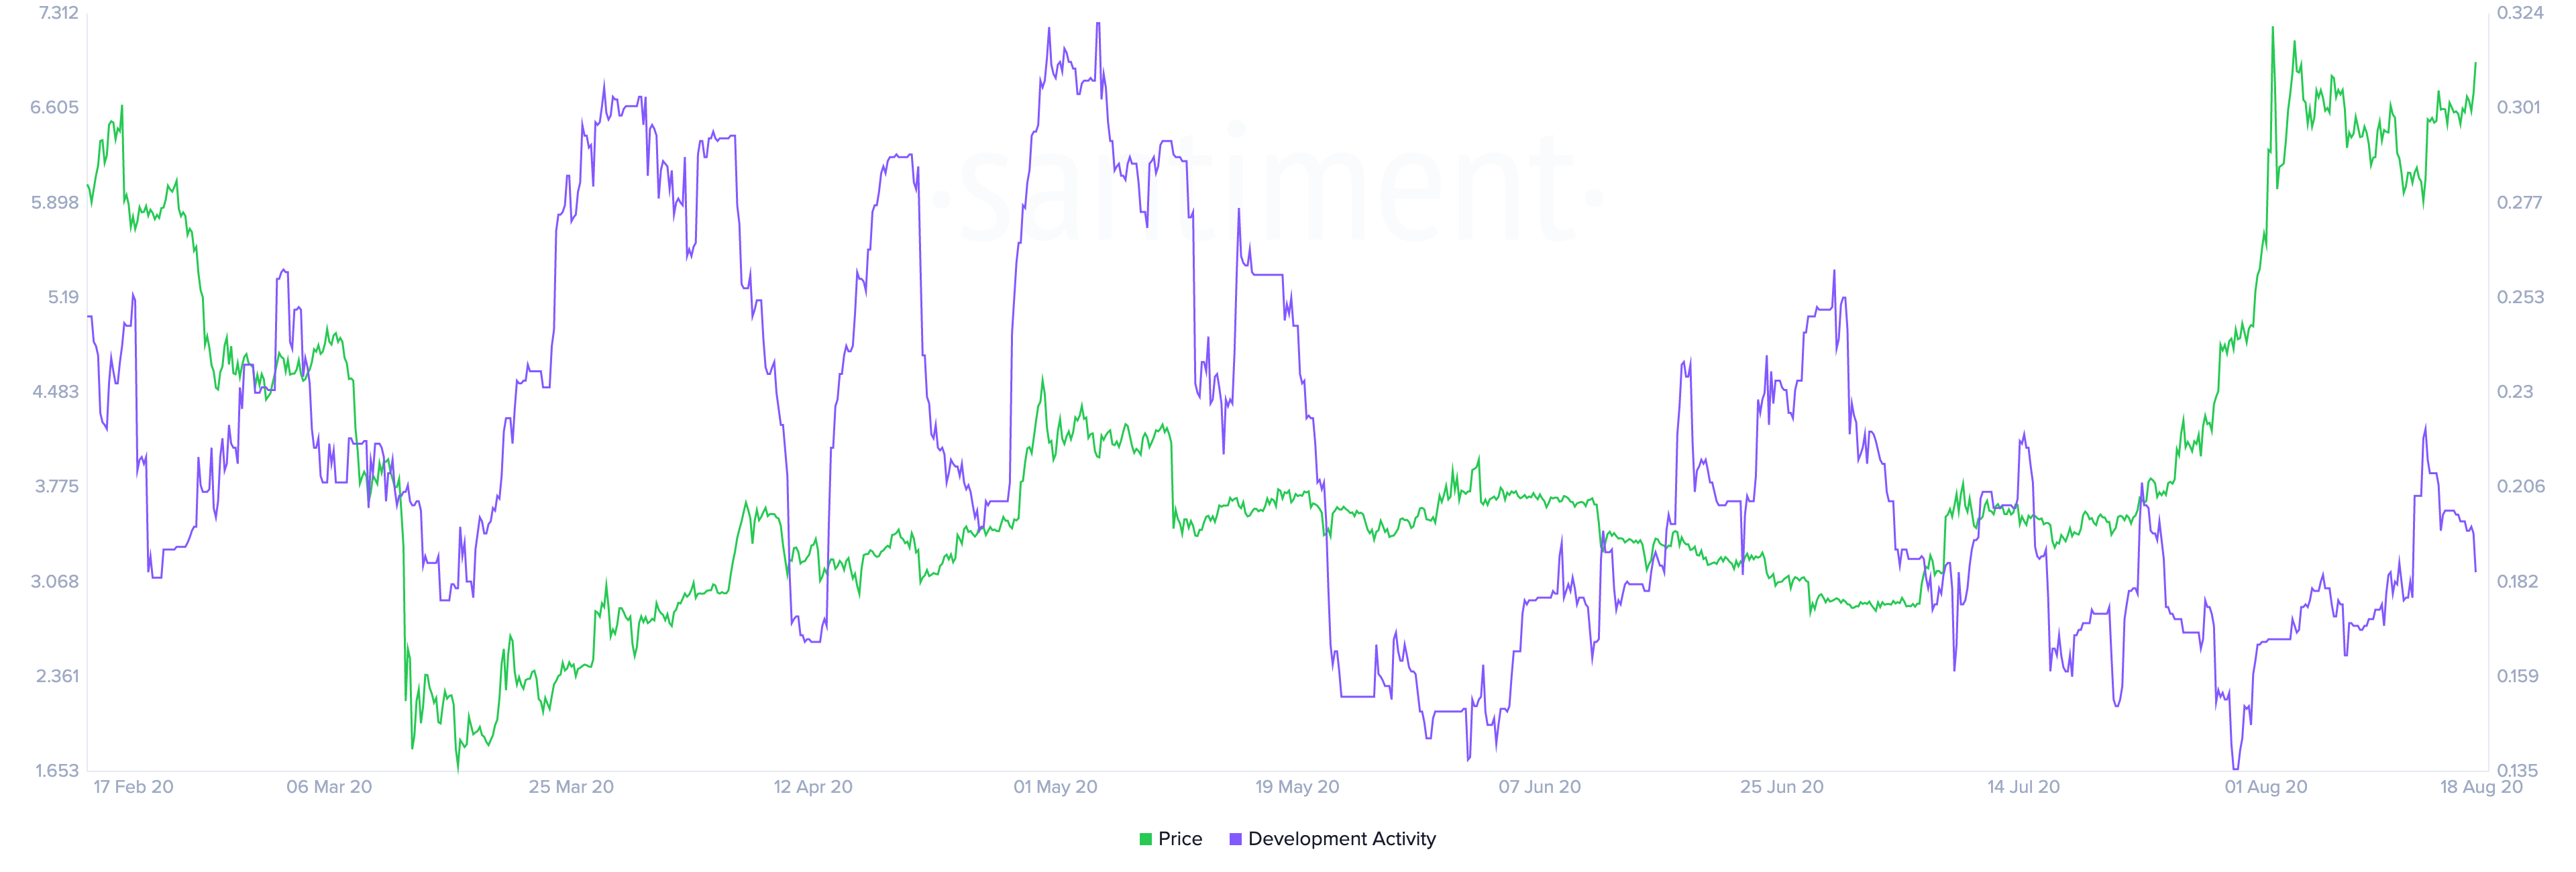
While the San Francisco-based startup strives to find compelling uses for its distributed ledger technology, data from Santiment reveals that the development activity on the network has been declining.
The behavior analytics firm takes into consideration the number of public GitHub events that a given project generates, such as issues, pull requests, comments, and repositories, to name a few.
Based on this on-chain metric, Ripple’s commitment to creating a working product and continuously polishing its features does not reflect the recent announcement. Since the beginning of the year, the development activity on the XRP protocol dropped from a score of 25 to 11.6.
It remains to be seen whether the new initiative will be remembered as one of Ripple’s unfulfilled promises.
Regardless, investors seem optimistic about XRP’s price action. The cross-border remittances token appears to have made a higher low on Jun. 27, for the first time since early 2018. If the buying pressure behind it continues to increase, it may have the ability to allow prices to break above mid-February’s high of $0.35 to make a higher high.
Under such circumstances, XRP’s multi-year downtrend will come to an end, and it will mark the beginning of a new bullish cycle.
On the Cusp of a New Bull Market
Market participants are growing overwhelmingly positive about the idea that a new bull market has begun.
This sense of optimism has been recorded by the Crypto Fear and Greed Index (CFGI), which is currently hovering around the highest levels of “greed” it has been in over a year. Based on historical data, each time this fundamental indicator senses “extreme greed” among crypto enthusiasts, the market tends to suffer significant losses.
While the different support levels mentioned above have yet to be broken to add credence to the bearish outlook, the CFGI spells trouble. Now more than ever, it is imperative to implement a robust risk management strategy to avoid getting caught on the wrong side of the trend.