
This Trading Pair Paints Bearish Picture for Ripple’s XRP
Ripple's slow but steady dissemination of XRP tokens could be impeding this cryptocurrency from achieving its upside potential.
Ripple’s XRP has posted significant losses over the past year and the trend may continue as prominent analysts within the industry noticed the break of a critical support level.
XRP Continues Trending Down
Ripple has done everything in its power to limit the effects of the scheduled dilution of the XRP market over the past few years.
It now appears that their efforts have been in vain as XRP continues to disappoint investors.
The cross-border remittances token has a negative year-to-date (YTD) return of over 32% against the U.S. dollar. The losses are even higher when taking into consideration the XRP/BTC trading pair.
This altcoin has a negative YTD of more than 56% against Bitcoin.
While many think that it is about time XRP reaches a market bottom, that may not yet be the case.
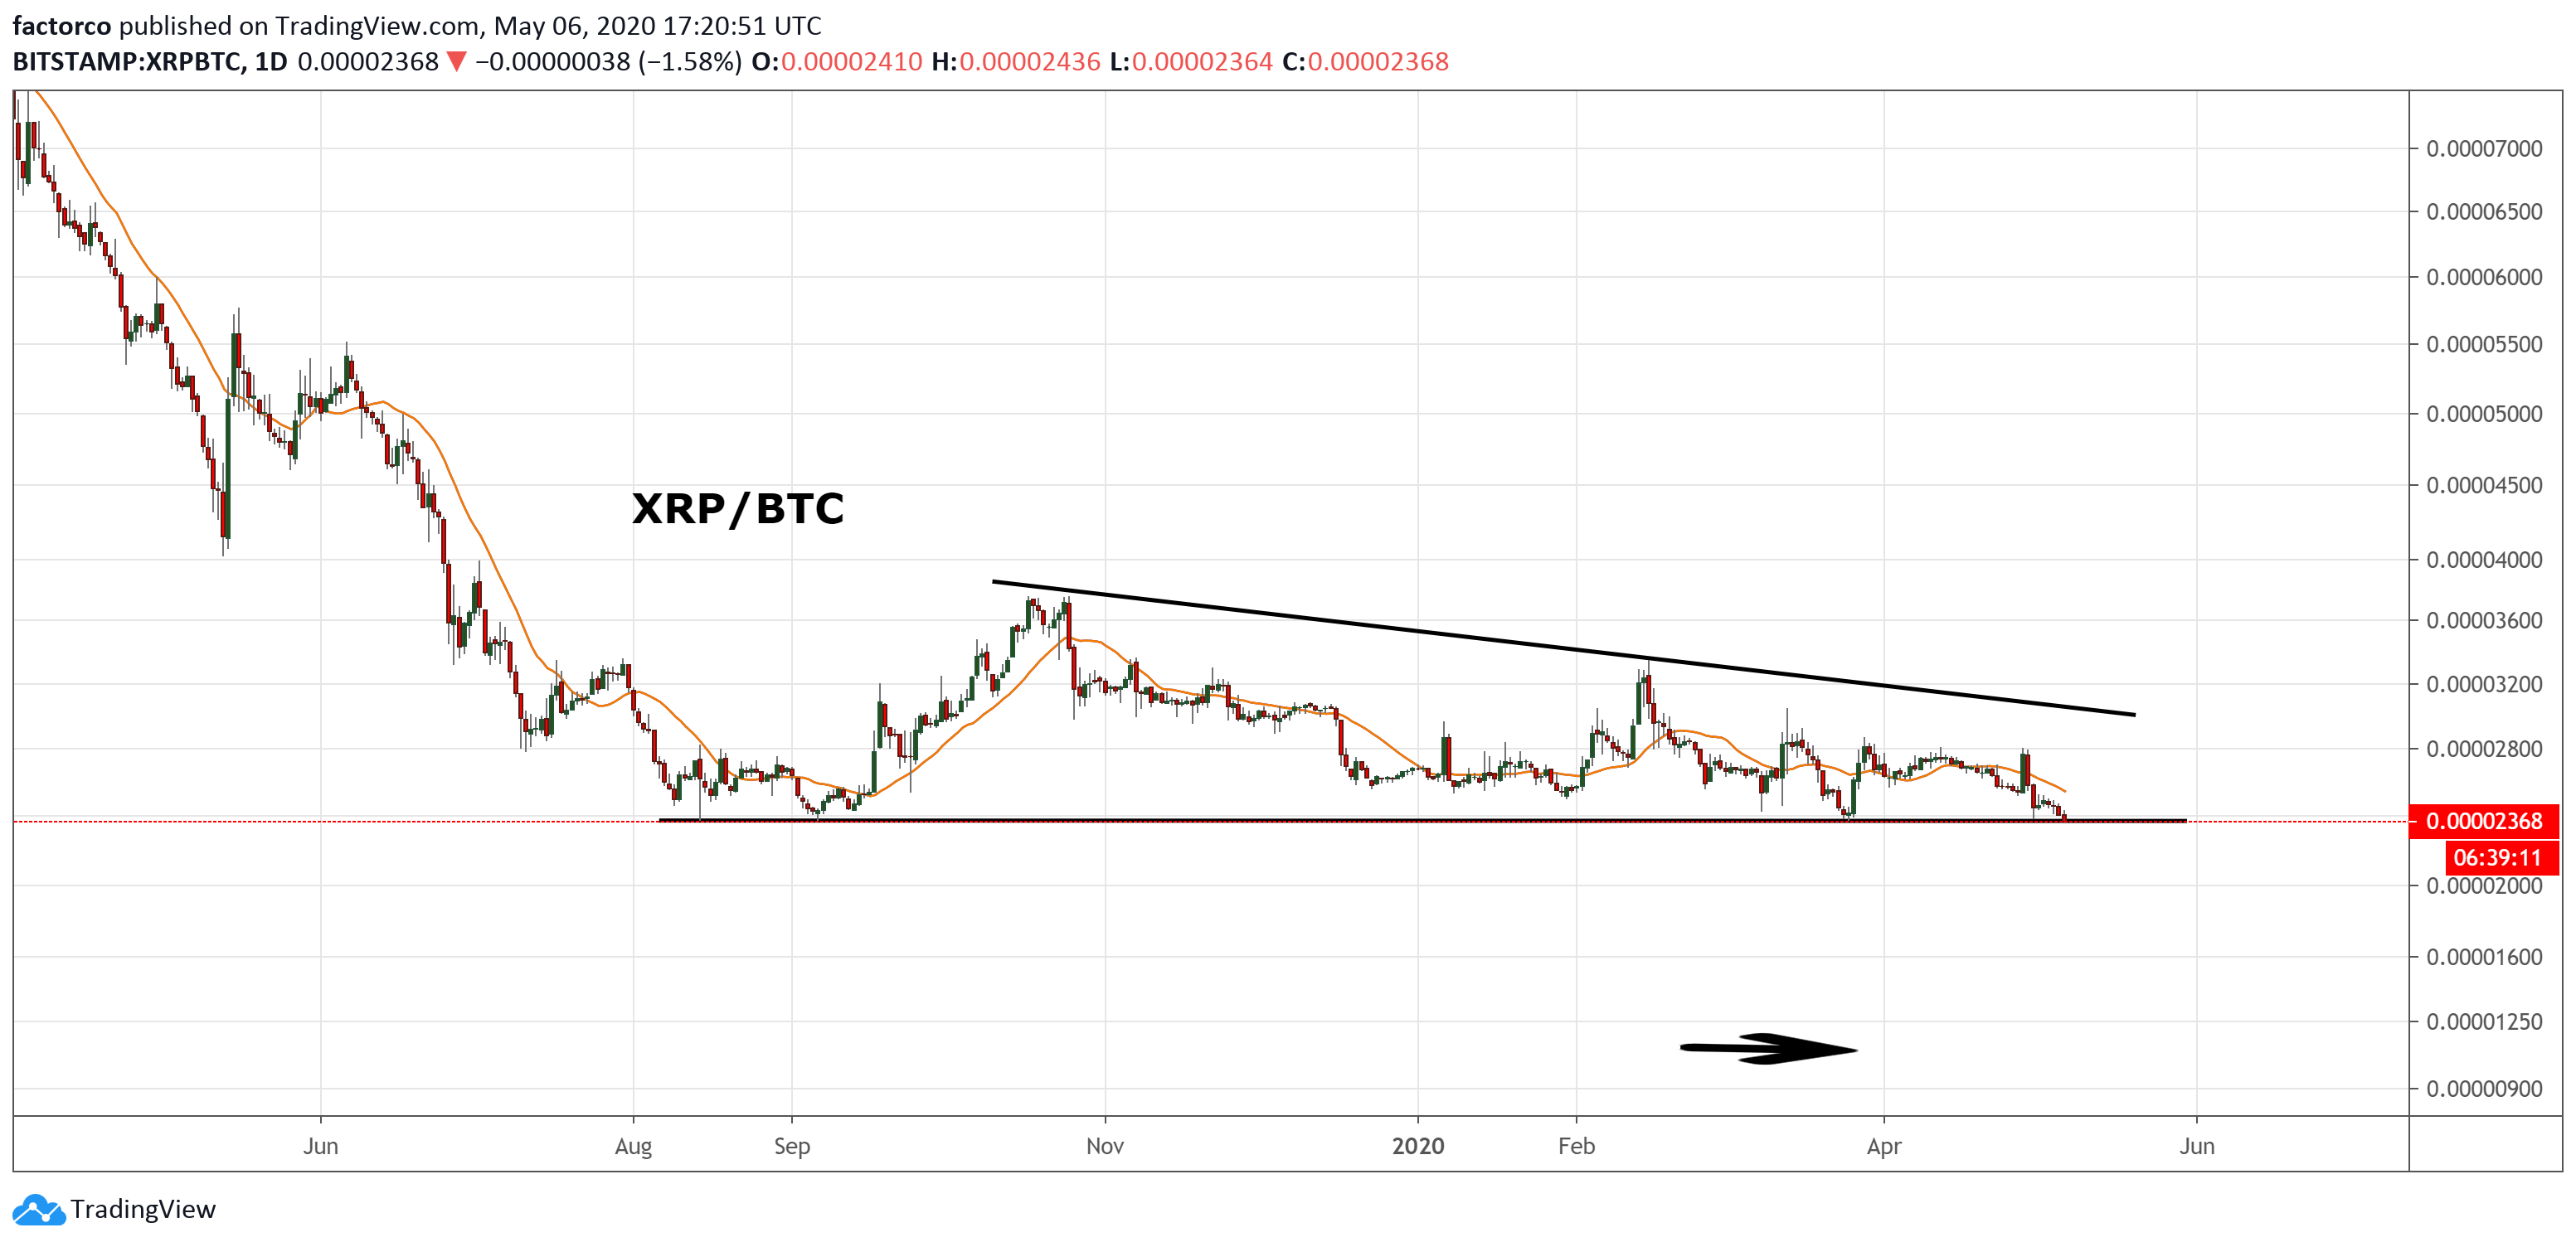
Peter Brandt, a 45-years trading veteran, stated that the international settlements coin has been forming a descending triangle for over the past eight months on its daily chart. Such a bearish formation represents a “planned distribution of assets by insiders or bag holders who are attempting to push the bag off on an unsuspecting public.”
Under this premise, Brandt maintains that these insiders are the ones keeping XRP from steeper declines.
Large investors appear desperate to bounce XRP off the 24,000 satoshis support level because breaking through it could lead to severe losses.
“If the bag holders back away, look for a decline to [11,000 satoshis],” said Brandt.
DonAlt, a renowned chartist within the crypto community, affirmed that support appears to be losing its strength. XRP “printed a new low” over the past few hours after consolidating for more than 250 days, according to the analyst.
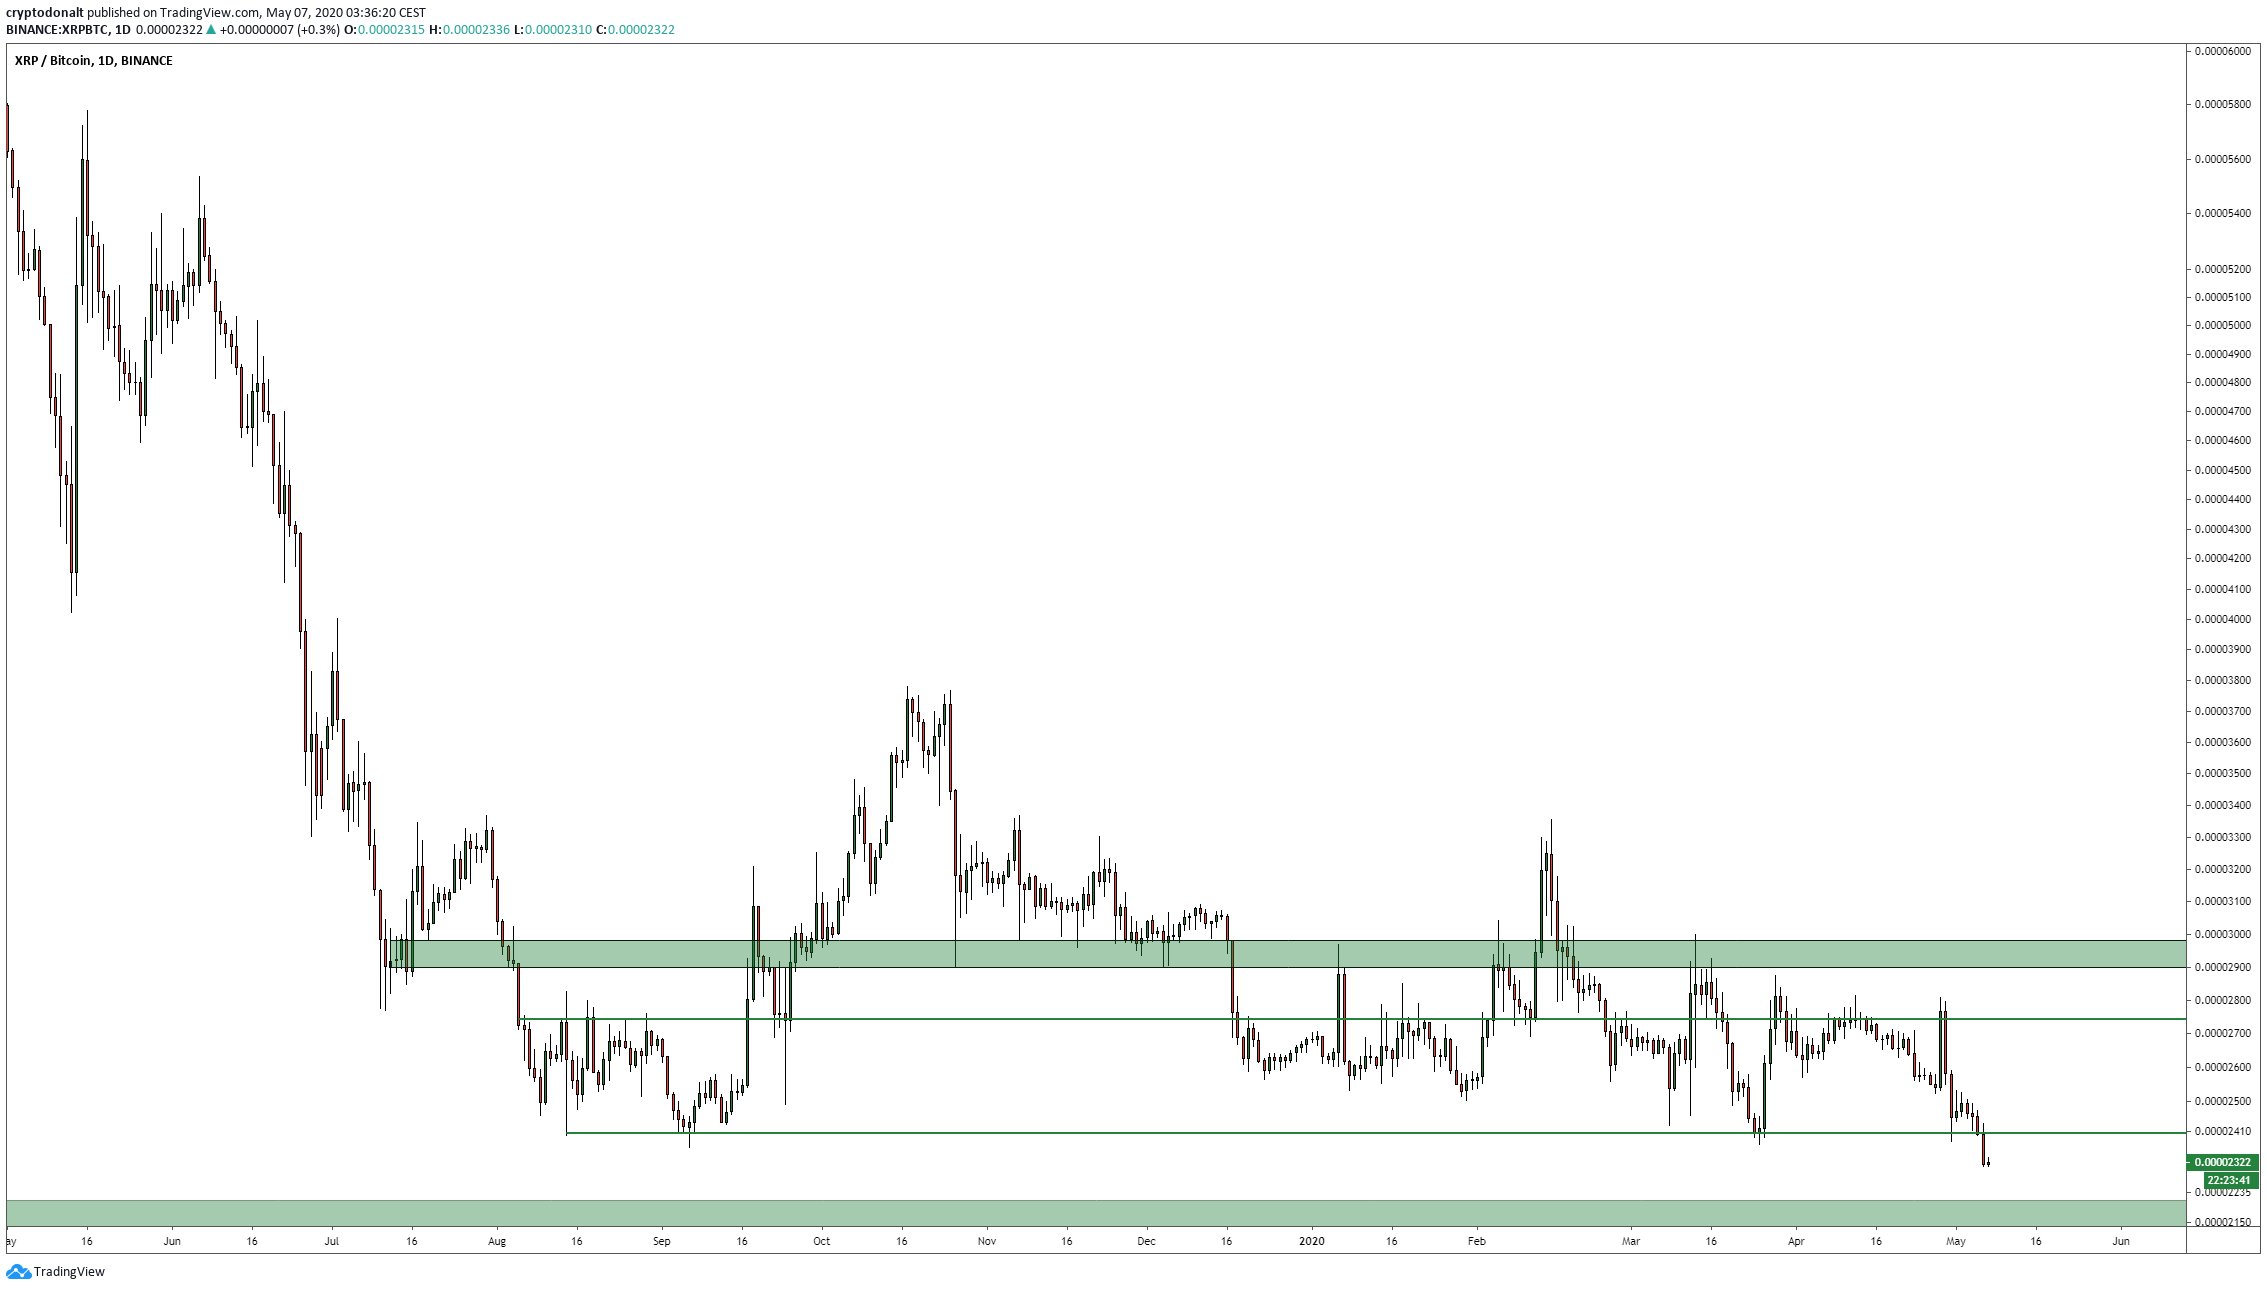
As all hell breaks loose with the XRP/BTC trading pair, the cross-border remittances token seems to be “holding up alright against the USD,” suggested Dave the Wave.
Everything’s Not Lost
Indeed, XRP has been able to recover most of the losses incurred during the March madness, surging over 95% since then. This altcoin now appears to be trading within a narrow trading range that is defined by the recent high of $0.236 and the $0.206 support level.
A daily candlestick close above or below this area will signal where the XRP/USD trading pair is headed next.
A break above this resistance could be followed by a spike in demand that sends this cryptocurrency towards the 127.2% Fibonacci retracement level. This supply barrier sits at $0.27.
Conversely, if the bag holders that Brandt mentioned let XRP drop below support, an increase in selling pressure may soon follow. Such a downward impulse could allow this altcoin to fall to the 38.2% Fibonacci retracement level that sits at nearly $0.19.
As Bitcoin’s halving approaches, excessive volatility across the whole market is expected.
Now more than ever, it is essential to employ a robust risk management strategy or stay out of the market to avoid adversity.