
Shutterstock cover by REDPIXEL.PL
Trading Veteran Eyes Key Bitcoin Support, Suggests Correction Complete
Bitcoin seems primed to resume its uptrend as long as it holds above a critical support barrier.
Bitcoin has entered a new corrective period. Still, one of the most prominent technical analysts in the industry suggests that the downtrend may have reached exhaustion.
Bitcoin Hits Local Bottom
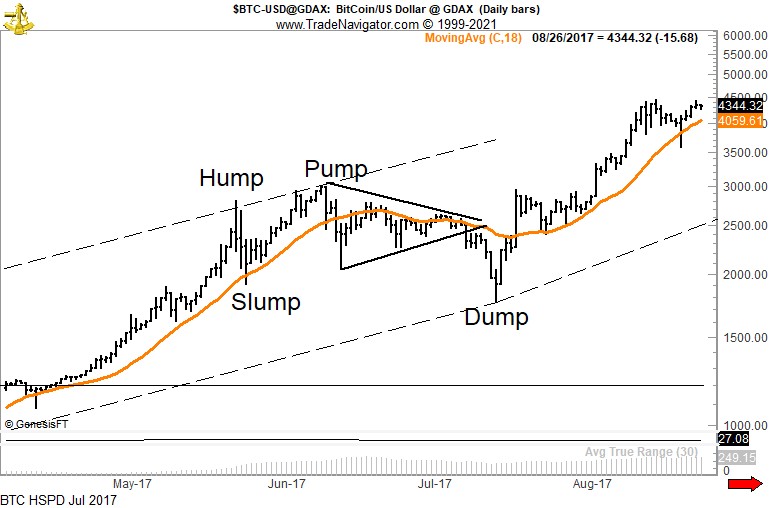
Peter Brandt, CEO of Factor LLC, emphasized that Bitcoin’s price tends to create a clear pattern before it suffers steep corrections during its famous parabolic advances.
Such a market structure was characteristic of the 2015-2017 bull market as it repeated throughout every retracement.
The 40-years trading veteran defines such pullbacks as “Hump, Slump, Pump, and Dump.”
“The Hump to Slump was a simple correction. Then the Pump into new highs solicited FOMO by retail customers. Following the Pump came a longer correction, then the Dump washed out the FOMO buyers. Following the Dump, the bull market continued,” said Brandt.
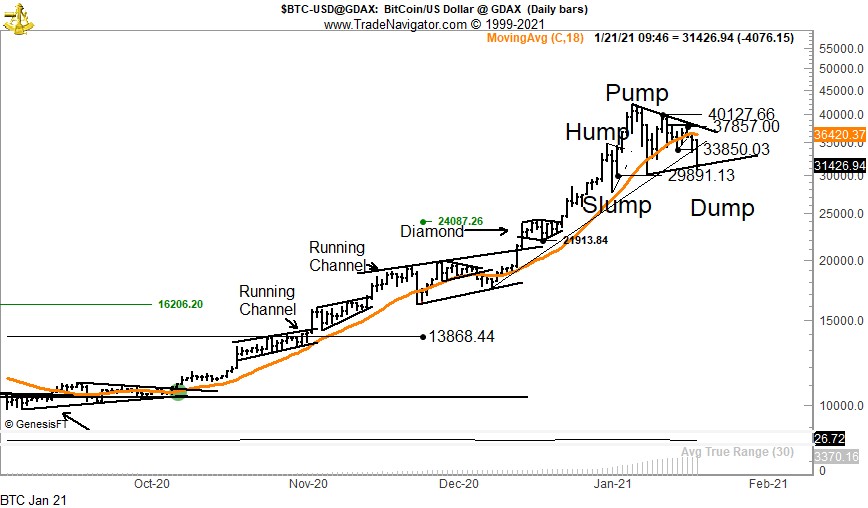
The analyst believes that Bitcoin’s ongoing bull run could be following the same script since the latest retracement meets Brandt’s pullback definition.
The Hump occurred between Dec. 27, 2020, and Jan. 3, 2021, when BTC’s price rose by nearly 35%, from a low of $25,850 to a high of $34,830. The 20% correction that followed towards $27,800 was the Slump. The subsequent 51.50% upswing towards a new all-time high of $42,125 can be regarded as the Pump.
Brandt now implies that the 31.40% decline that Bitcoin has gone through over the past two weeks could be described as the Dump.
According to this narrative, the flagship cryptocurrency’s corrective period might be over, and the uptrend will likely resume.
Despite the bullish outlook, Brandt warned that there is a chance this thesis could be invalidated.
Warning Signs on the Horizon
An alternative to the “Hump, Slump, Pump, and Dump” sequence is Bitcoin hit a market top not dissimilar to the top in mid-December 2017.
One of the most significant bearish signs the declining 18-day moving average, which will be confirmed by a decisive candlestick close below $30,070.
“The 18-DMA line has rolled over. Jan 21 was a WBB down. A second down WBB closing below the Jan 21 low would turn the Factor Daily Trend Model from Up to Down,” said Brandt.
Based on his analysis, it appears that Bitcoin’s fate will depend on its ability to close above or below the $30,000-$38,000 range.
By slicing through the overhead resistance, the uptrend will resume, and BTC will aim for new all-time highs.
Nonetheless, if selling pressure mounts around the current price levels, it may have the strength to push this cryptocurrency’s market value below $30,000. A more complex retracement would take place if this were to happen, sending BTC towards $26,000 or lower.
Disclosure: At the time of writing, this author held Bitcoin and Ethereum.