TRON / USD Technical Analysis: Buyers Taking A Break

Share this article
- TRON is bearish in the short-term after buyers failed to break the pair’s former monthly trading high
- Price has fallen below a key trendline on the four-hour time frame putting the pair under near-term pressure
- The medium-term outlook is bullish as price trades above the pair’s 200-day moving average
TRON / USD Short-term price analysis
In the short-term, TRON is starting to turn bearish after buyers failed to breach the pair’s former monthly trading high and price dipped below a key trendline on the four-hour time frame.
The bearish head and shoulders pattern on the four-hour time frame remains valid, with a series of smaller bearish head and shoulders patterns forming within the larger pattern.
Technical indicators on the mentioned time frame have also turned lower, with the RSI indicator appearing very weak.
Pattern Watch
A potential bearish head and shoulders pattern is starting to take shape, although a drop below the 0.02000 level would cement the view that the bearish pattern has a higher chance of forming and eventually playing-out to the downside.
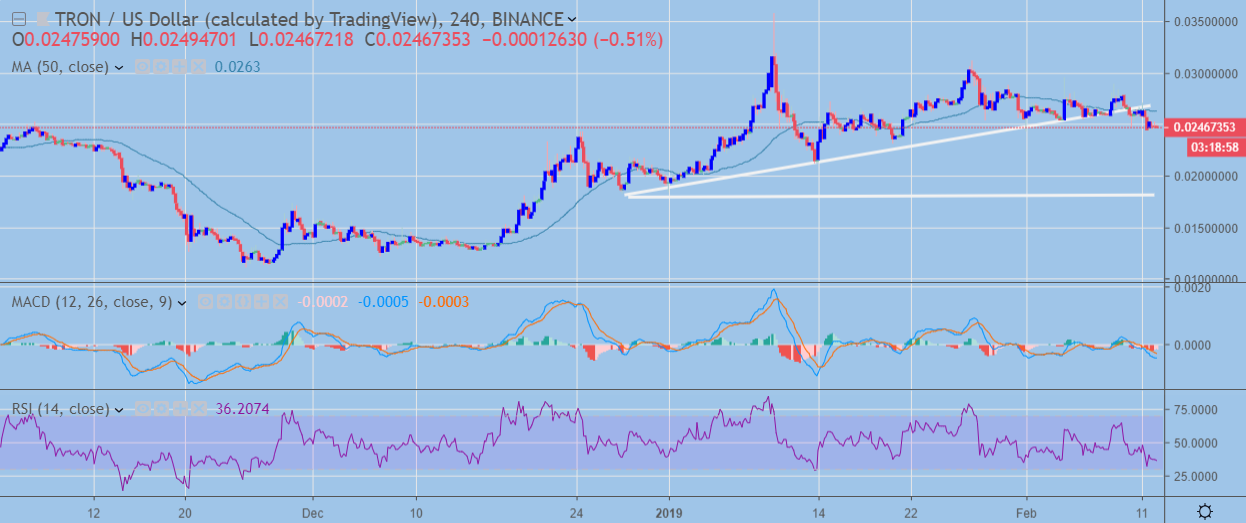
TRX / USD H4 Chart (Source: TradingView)
Key Moving Averages
Price is currently trading below the pair’s 50-period moving average on the four-hour time frame, which is consistent with near-term weakness.
MACD
Momentum histogram is trending lower with a bearish signal line crossover occurring on the mentioned time frame.
TRON / USD Medium-term price analysis
In the medium-term, the TRX / USD is bullish with price trading above its trend defining 200-day moving average for the past four trading weeks.
A large inverted head and shoulders pattern is clearly visible on the daily time frame, although price is still trading below the neckline of the bullish pattern.
The TRX / USD pair is currently testing its 50-day moving average, while technical indicators are turning lower on the daily time frame.
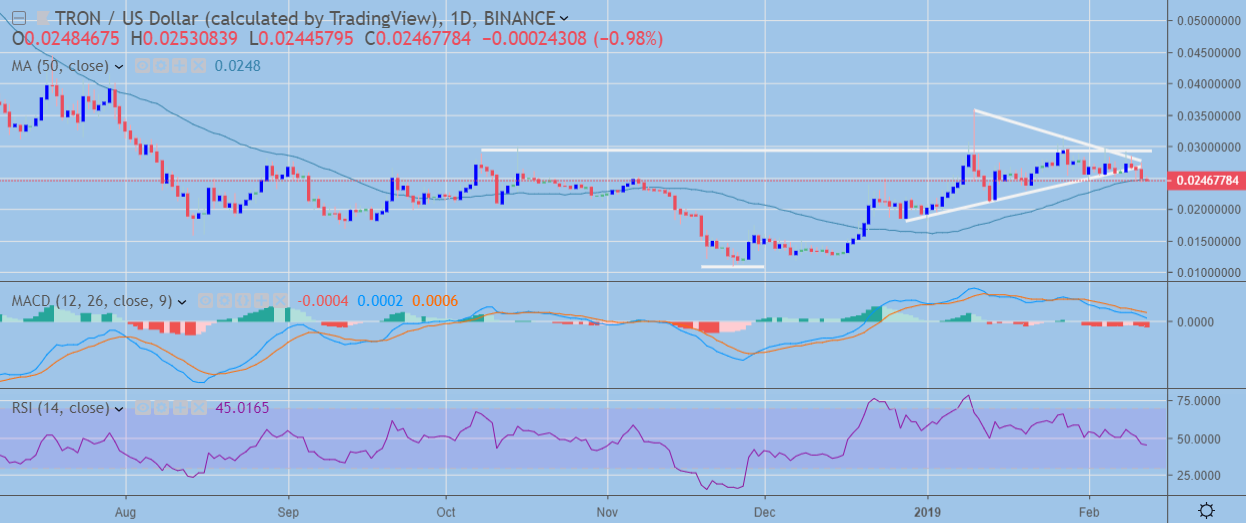
TRX / USD Daily Chart (Source: TradingView)
Pattern Watch
Aside from the bullish inverted head and shoulders pattern on the daily time frame, sellers have recently pushed price below a symmetrical triangle pattern which may signal further near-term weakness.
Key Moving Averages
Traders should watch for sellers to test the TRON’S 200-day moving average if selling accelerates below the pair’s 50-day moving average.
Relative Strength Index
The RSI indicator has turned bearish on the daily time frame and has further scope to move considerably lower.
Conclusion
Traders should watch for near-term weakness in TRON as some bearish short-term developments are currently underway.
Overall, a moderate bullish stance is favored in the medium-term, especially if bulls can keep price above the pair’s 200-day and ignite the inverted head and shoulders pattern on the daily time frame.
Decentral Media, Inc., the publisher of Crypto Briefing, is not an investment advisor and does not offer or provide investment advice or other financial advice. Nothing on this website constitutes, or should be relied on as, investment advice or financial advice of any kind. Specifically, none of the information on this website constitutes, or should be relied on as, a suggestion, offer, or other solicitation to engage in, or refrain from engaging in, any purchase, sale, or any other any investment-related activity with respect to any transaction. You should never make an investment decision on an investment based solely on the information on our website, and you should never interpret or otherwise rely on any of the information on this website as investment advice. We strongly recommend that you consult a licensed investment advisor or other qualified financial professional if you are seeking investment advice on an investment.
Share this article
