VeChain Price Analysis: Swift Progress
VeChain is set to continue its bullish run.

Share this article
- VeChain has a bullish short-term and medium-term trading outlook
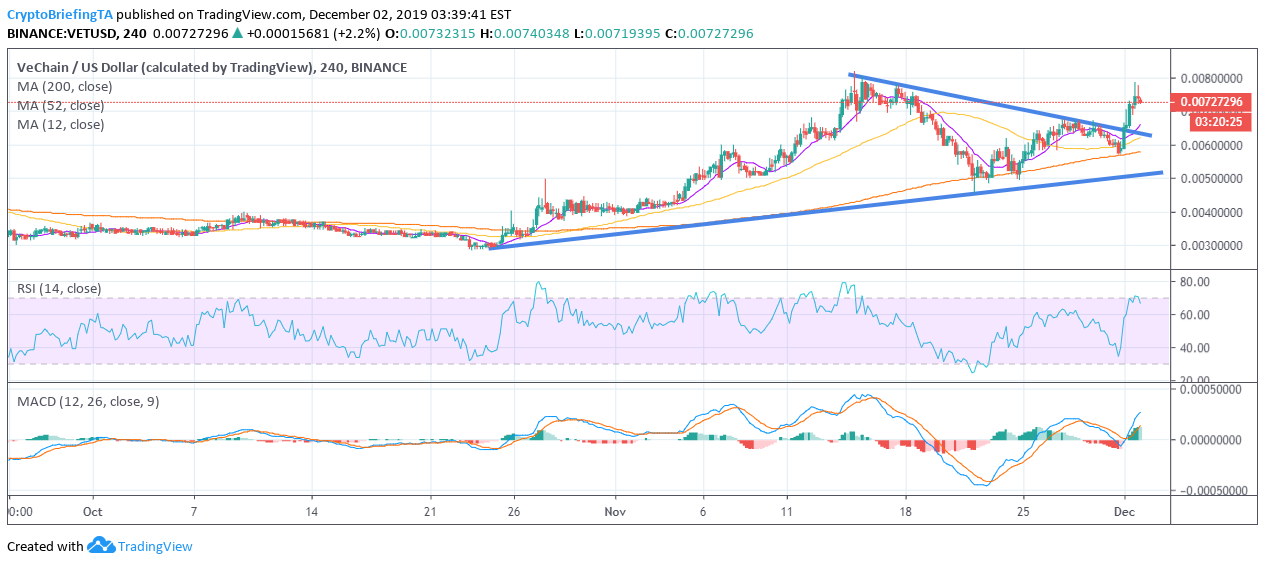
- The four-hour time frame shows that a bullish breakout from a wedge pattern has taken place
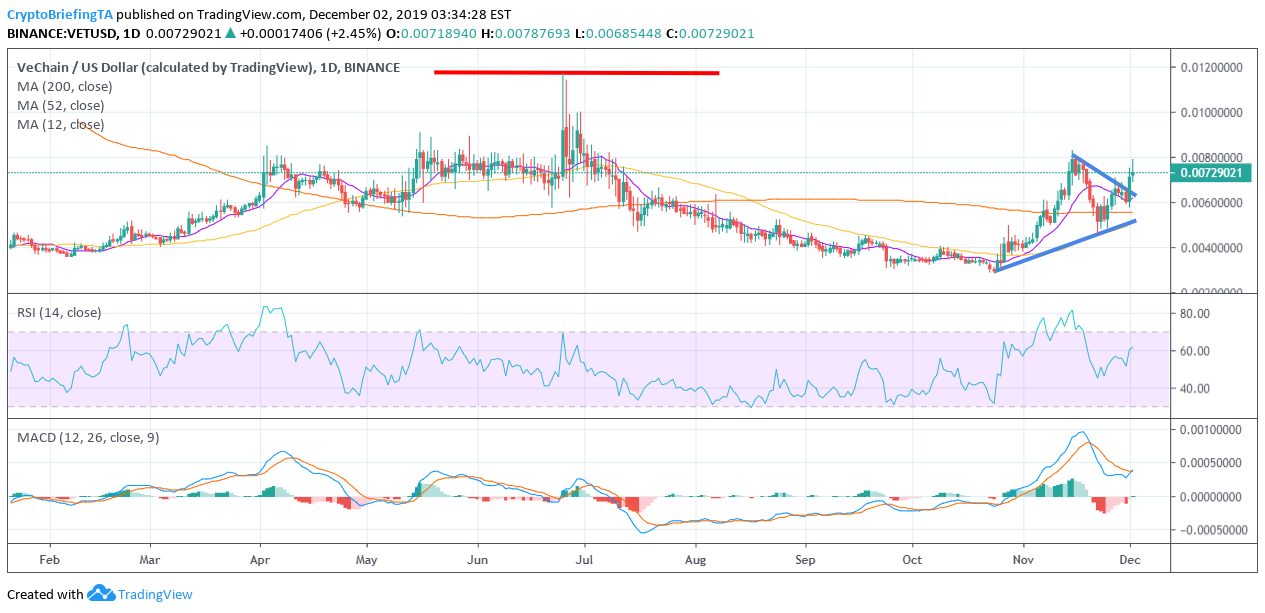
- The daily time frame shows that a bearish head and shoulders pattern is still looming over the VET/USD pair
VeChain is outperforming the broader cryptocurrency market on Monday with strong double-digit gains, following bullish fundamental news over the weekend.
The VET/USD pair has gained over 20 percent since the start of December and is currently trading around 80 percent higher from its November opening price.
Technical analysis shows that the VET/USD pair performed a bullish wedge breakout on the daily time frame, moving the cryptocurrency within touching distance of the November monthly high.
The four-hour time frame shows that a breakout above the November monthly trading high could encourage further technical buying towards the $0.01 level.
The daily time frame shows that the VET/USD is trading well-above is 200-day moving average, although a large head and shoulders pattern is still weighing on the cryptocurrency.
Bulls need to rally VeChain toward the $0.012 level in order to invalidate the bearish pattern. If buyers can invalidate the bearish pattern, the VET/USD pair could stage a rally toward $0.02.
The Relative Strength Index on the daily time frame shows that VeChain is not yet overbought, despite the large double-digit advance in the cryptocurrency, while the MACD indicator is generating a strong buy signal.
According to the latest sentiment data from The TIE, VeChain’s short-term sentiment is neutral at 56 percent, while the overall long-term sentiment is bullish at 78 percent.
Upside Potential
The four-hour time frame shows that key technical resistance is now located at the $0.008 and $0.01 levels.
Key technical resistance over the medium-term is located at the $0.012 and $0.02 levels.
Downside Potential
The four-hour time frame is showing that the VET/USD pair has strong medium-term technical support around the $0.006300 and $0.005500 levels.
Critical long-term technical support for the VET/USD pair is located at the $0.0045 level.
Summary
VeChain has broken above a large wedge pattern on the four-hour time frame, putting the November monthly price high back in focus.
A sustained rally above $0.008 would be extremely bullish for the VET/USD pair and could spark a challenge toward the $0.012 level.
Share this article
