Verge / USD Technical Analysis: Breaking Record Lows

Share this article
- Verge is bearish in the short-term with price creating lower highs and lower lows
- The XVG / USD pair has broken below a triangle pattern on the daily time frame
- The bearish medium-term outlook for Verge looks set to worsen
Verge / USD Short-term price analysis
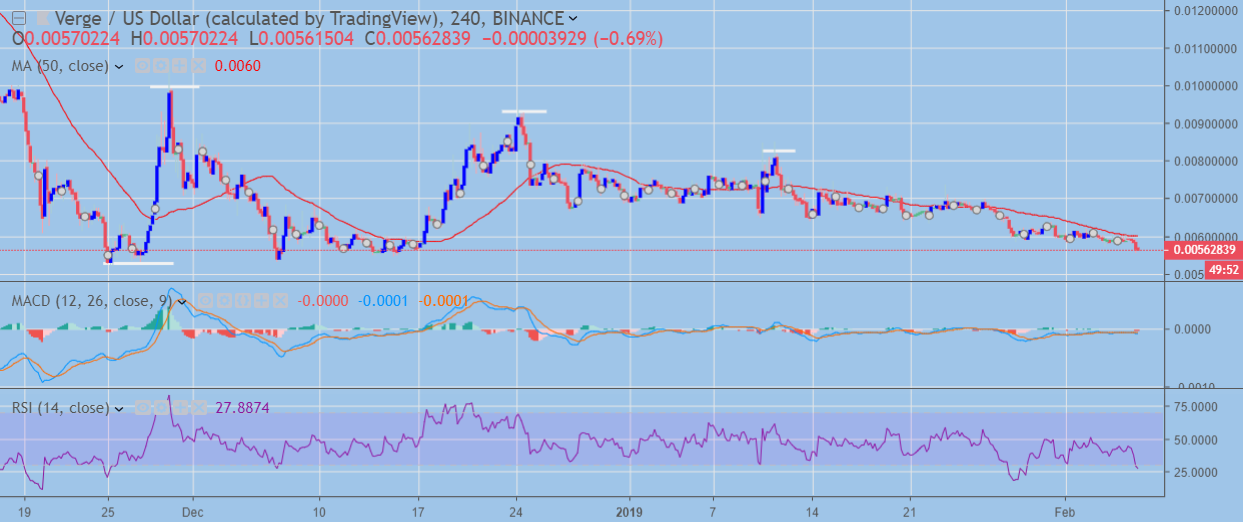
In the short-term, Verge is bearish and has been gradually declining since the middle of January. Price is creating bearish lower highs and lower lows with traders selling any upside rallies.
The XVG / USD pair is fast approaching its 2018 trading low as recent bearish selling pressures accelerate, a sustained move below this key trading low would be an important technical development for this cryptocurrency.
Failure to breach the November low would likely provoke a sizeable buying reaction, as traders have previously struggled to breach this important low.
Pattern Watch
The series of bearish lower highs remains the dominant theme over the short-term horizon. The November trading low is also a key area to watch.

XVG / USD H4 Chart (Source: TradingView)
Relative Strength Index
The Relative Strength Index has turned bearish on the four-hour time frame and is signaling further weakness ahead.
MACD Indicator
The MACD histogram is starting to follow price lower on the mentioned time frame, although the signal line has yet to crossover.
Verge / USD Medium-term price analysis
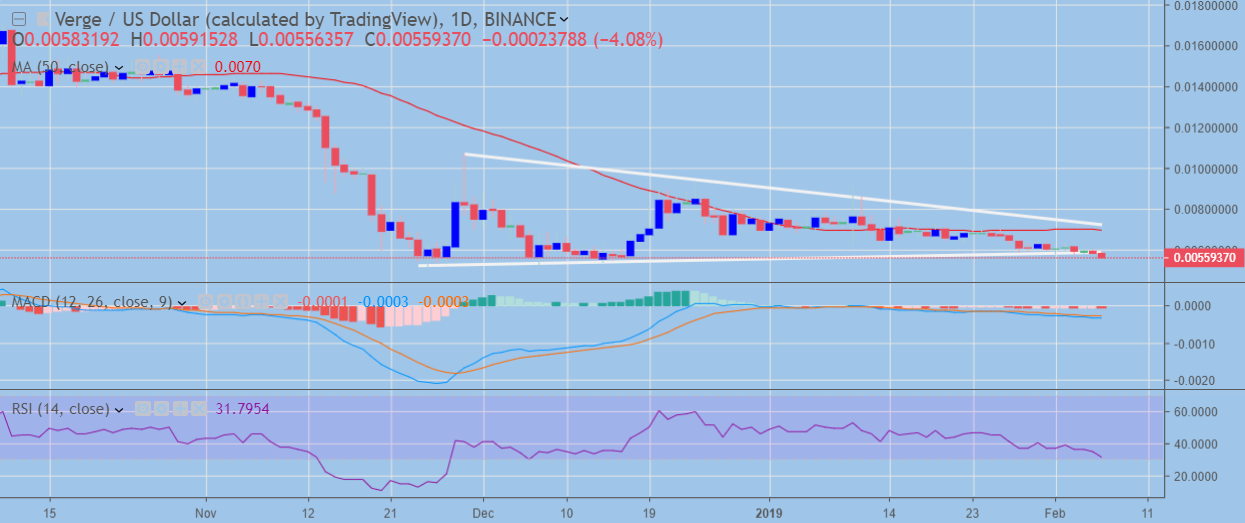
Verge is bearish across the medium-term time frame and is starting to create an increasing amount of distance between price and its 50-day moving average.
The XVG / USD pair appears to be testing towards its former yearly trading low after recently staging a bearish breakout under the neutral triangle pattern.
Technical indicators on the daily time frame are starting to turn lower and suggest the bearish breakout maybe valid.
Pattern Watch
Although a breakout has occurred, medium-term traders will likely watch closely for a series of bearish daily price closes under the triangle pattern for further technical confirmation.

XVG / USD Daily Chart (Source: TradingView)
MACD Indicator
The MACD histogram is turning lower alongside the signal line, with the indicator showing no bullish divergence on the daily time frame.
RSI Indicator
The Relative Strength Index has remained consistently weak so far this month and appears to be turning more bearish on the daily time frame.
Conclusion
Verge appears to be headed for another technical test of its former yearly trading low; this is likely to be a major deciding point for Verge over the short, medium and longer-term horizons.
The long-term downtrend and the recent bearish breakout below the triangle pattern on the daily time frame suggests the path of least resistance for the XVG / USD is still to the downside.
Decentral Media, Inc., the publisher of Crypto Briefing, is not an investment advisor and does not offer or provide investment advice or other financial advice. Nothing on this website constitutes, or should be relied on as, investment advice or financial advice of any kind. Specifically, none of the information on this website constitutes, or should be relied on as, a suggestion, offer, or other solicitation to engage in, or refrain from engaging in, any purchase, sale, or any other any investment-related activity with respect to any transaction. You should never make an investment decision on an investment based solely on the information on our website, and you should never interpret or otherwise rely on any of the information on this website as investment advice. We strongly recommend that you consult a licensed investment advisor or other qualified financial professional if you are seeking investment advice on an investment.
Share this article
