Waves Price Analysis WAVES / USD: Building Strength
Waves is building short-term upside momentum.

Share this article
- Waves remains bearish over the short-term and the medium-term horizon
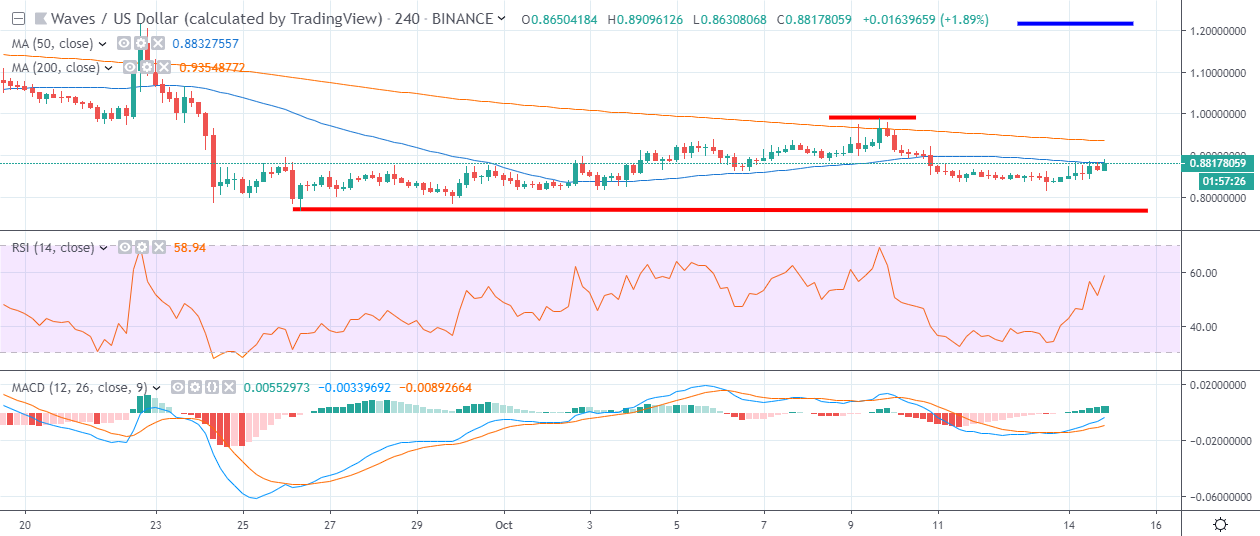
- The four-hour time shows that a bearish head and shoulders pattern has formed
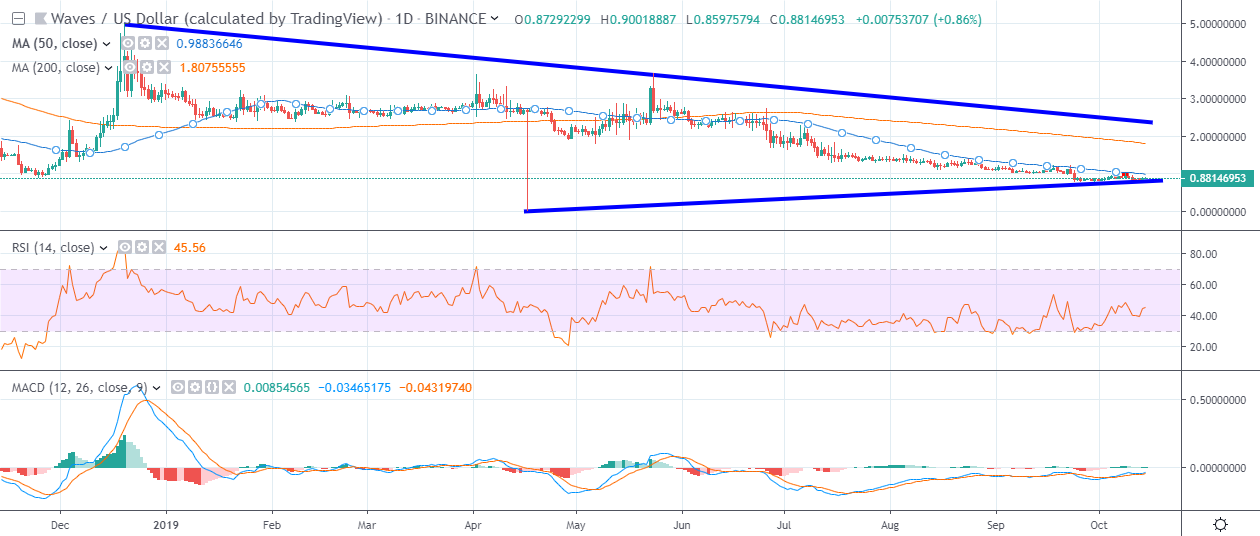
- The daily time frame shows that the WAVES / USD pair is trapped within a huge triangle pattern
Waves is showing signs of possible price stabilization, as the cryptocurrency attempts to break its multi-month losing streak. The WAVES / USD pair is currently trading close to five percent higher on a monthly basis, as bulls attempt a potential breakout above its 50-period moving average on the four-hour time frame.
Calling a potential medium-term bottom in the WAVES / USD pair may be premature at this stage, given the protracted down trend in the cryptocurrency.
The technicals for the cryptocurrency also remain bearish across both the short and the medium-term. However, a broader market rally could certainly be the catalyst for a solid rebound or correction in the WAVES / USD pair.
The four-hour time frame is currently showing that a head and shoulders pattern has formed, with the downside projection of the bearish pattern close to twenty-five percent.
Bulls would need to rally the cryptocurrency above the $0.9900 level to invalidate the bearish pattern. A rally of around thirteen percent would need to occur from current levels for this to happen.
In percentage terms, the WAVES / USD pair trades around thirteen percent higher from the September trading. The WAVES / USD pair trades around seventy five percent lower from its current 2019 trading high and is currently around seventy percent in the red for the year.
Medium-term analysis shows that a large triangle pattern is forming on the daily time frame, with price currently consolidating around the bottom of the triangle pattern, as downside selling interest starts to wane.
It is worth noting that the WAVES / USD pair has not traded above its 50-day moving average since mid-June, with the 50-day moving average currently located around the $0.9900 level. Traders should watch for a potential upside breakout above the $0.9900 level if the WAVES / USD pair continues to grind higher.
According to the latest sentiment data from TheTIE.io, the short-term sentiment towards Waves is neutral, at 45.00 %, while the overall long-term sentiment towards the cryptocurrency is bearish, at 29.50%.
Upside Potential
The four-hour time frame highlights that bulls are attempting to move past the 50-period moving average, around the $0.8800 level. The WAVES / USD pair’s 200-period moving average, currently offers the strongest form of resistance above, at the $0.9300 level.
The daily time frame highlights the $0.9900 level as major technical resistance if bulls gain strength above the key short-term moving averages. A breakout above the $0.9900 level could trigger a major breakout towards the $1.2000 level.
Downside Potential
The lower time frames are currently showing that the short-term trend remains bearish. Key short-term support is located at the $0.8000 and $0.7700 levels.
The daily time frame is showing a large triangle pattern, with the $0.7700 the bearish breakout level traders should monitor if the overall downtrend resumes.
Summary
Waves is building short-term upside momentum, as the cryptocurrency attempts to break its four-month losing streak.
Caution is advised as the overall trend remains bearish, although traders should be prepared to react if a breakout above the $0.9900 level occurs.
Check out our coin guide for Waves.
We wrote several analytical reports on Waves, including a SIMETRI initiation and updates.
Share this article
