Waves / USD Technical Analysis: Consolidating Price

Share this article
- Waves has a neutral short-term trading bias, with the cryptocurrency still in consolidation mode
- The four-hour time frame chart shows the cryptocurrency trapped inside a narrowing triangle pattern
- Waves is bullish over the medium-term, with price still holding above its 200-day moving average
Waves / USD Short-term price analysis
Waves has a neutral short-term bias, with the trading action surrounding the Waves / USD pair currently focused around its 200-period moving average on the four-hour time frame.
Range-bound trading action has persisted since late January, with the four-hour time frame showing that price is currently trapped within an increasingly narrow triangle pattern.
Technical indicators are also largely flat on the four-hour time frame and highlight that the Waves / USD pair currently lacks a clear directional short-term bias.
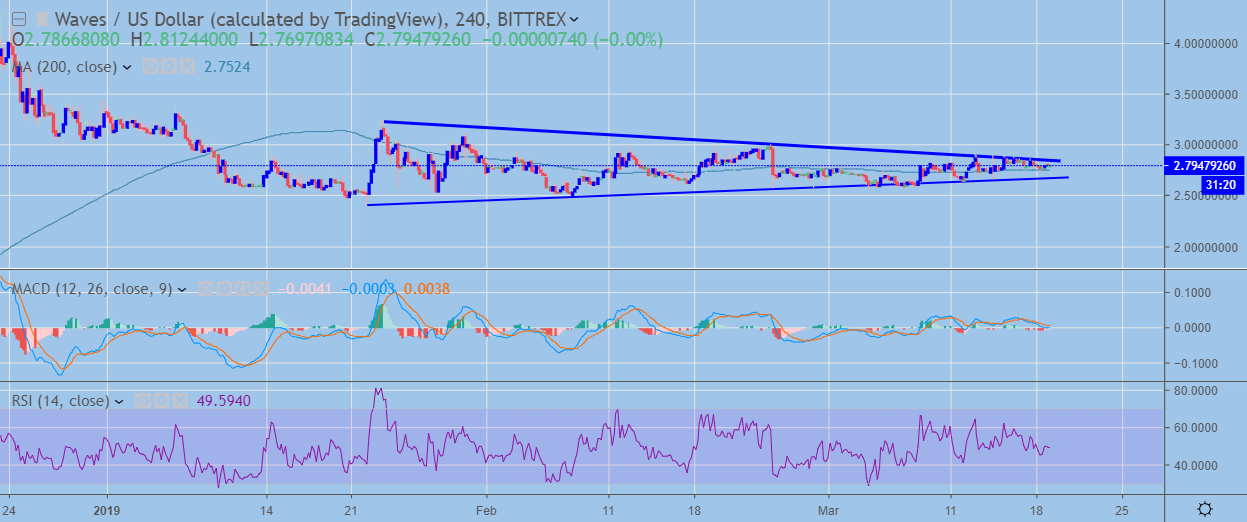
WAVES / USD H4 Chart (Source: TradingView)
Pattern Watch
Traders should note that a bullish breakout from the triangle pattern on the four-hour time would take the Waves / USD pair to a fresh 2019 trading high.
MACD Indicator
The MACD indicator on the four-hour time frame is currently flatlined with no clear trading bias.
Relative Strength Index
The RSI indicator on the mentioned time frame is also flat and is trading around the neutral level.
Waves / USD Medium-term price analysis
In the medium-term, the Waves / USD pair remains technically bullish, with the cryptocurrency still trading well above the 200-day moving average.
The daily time frame chart shows price trapped within the middle of a horizontal price channel, which the cryptocurrency has been trapped within since the start of the year.
Technical indicators on the daily time frame are currently flatlined, which once again highlights the tight range-bound conditions the Waves / USD pair is trading within.
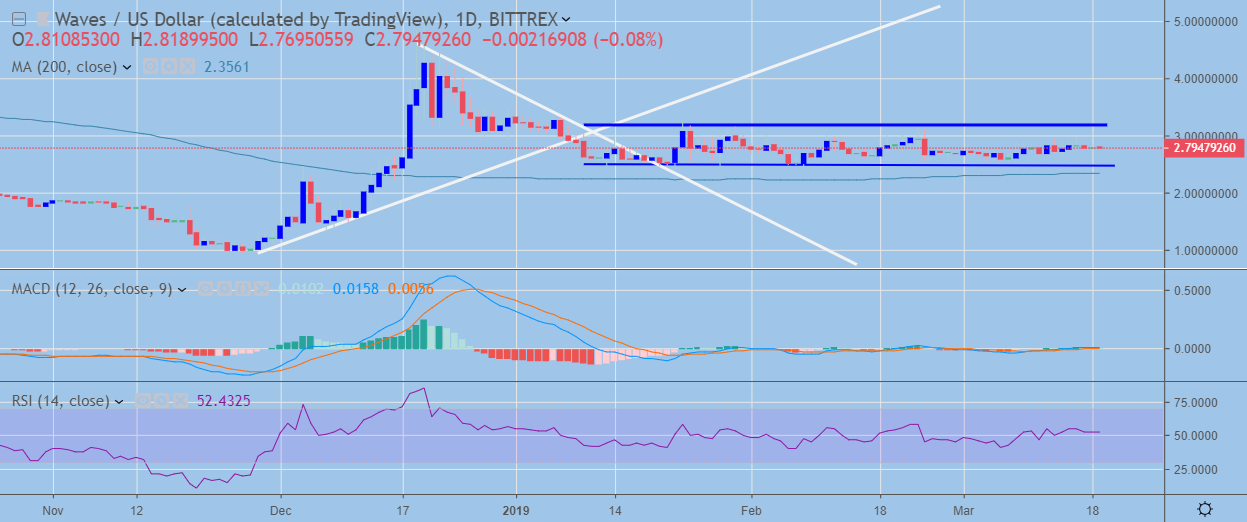
WAVES / USD Daily Chart (Source: TradingView)
Pattern Watch
Traders should wait for a clear break for the horizontal price channel, as the Waves / USD pair currently shows no clear directional bias.
MACD Indicator
The MACD indicator is neutral on the daily time frame, with the MACD histogram and the MACD signal line flatlined.
Relative Strength Index
The RSI indicator is also flatlined on the daily time frame and is currently providing no clear trading signal.
Conclusion
Waves holds onto its medium-term bullish bias, although the Waves / USD pair has entered into a period of extended price consolidation.
The four-hour time frame shows the most potential for a near-term technical breakout, with the increasing narrow triangle pattern pointing to a potential upcoming directional move.
Decentral Media, Inc., the publisher of Crypto Briefing, is not an investment advisor and does not offer or provide investment advice or other financial advice. Nothing on this website constitutes, or should be relied on as, investment advice or financial advice of any kind. Specifically, none of the information on this website constitutes, or should be relied on as, a suggestion, offer, or other solicitation to engage in, or refrain from engaging in, any purchase, sale, or any other any investment-related activity with respect to any transaction. You should never make an investment decision on an investment based solely on the information on our website, and you should never interpret or otherwise rely on any of the information on this website as investment advice. We strongly recommend that you consult a licensed investment advisor or other qualified financial professional if you are seeking investment advice on an investment.
Share this article
