XMR / USD Price Analysis: Bullish Breakout
The descending triangle pattern on Monero has been definitively broken, pointing to further gains ahead.

Share this article
- Monero has a bullish short-term trading bias, with the XMR / USD pair advancing to a new 2019 trading high
- The four-hour time frame shows that a bullish breakout from a descending wedge pattern is underway
- The XMR / USD pair has an increasingly bullish medium-term trading outlook
Monero / USD Short-term price analysis
Monero has a bullish short-term outlook, with the cryptocurrency advancing to a new 2019 trading high.
The four-hour time frame is showing that a bullish breakout is currently underway from a descending wedge pattern, with the November 19th, 2018 swing high as the upside objective of the bullish pattern.
Technical indicators are bullish on the four-hour time frame and continue to issue buy signals.
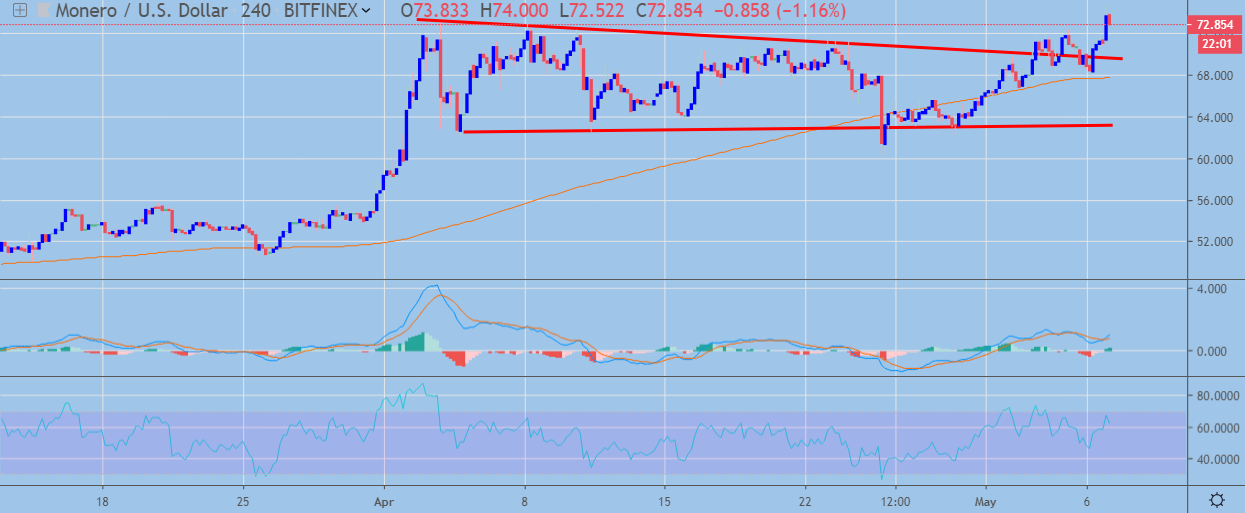 XMR / USD H4 Chart by TradingView
Pattern Watch
Traders should note that a bullish inverted head and shoulders pattern has also taken shape on the four-hour time frame.
Relative Strength Index
The RSI indicator is also bullish on the four-hour time frame, although it is approaching overbought territory.
MACD Indicator
The MACD indicator has turned bullish on the four-hour time frame and continues to generate a buy signal.
Monero / USD Medium-term price analysis
Monero has a bullish medium-term trading outlook, with the cryptocurrency continuing to advance above its trend defining 200-day moving average.
The daily time frame is showing a descending wedge pattern and an inverted head and shoulders pattern in play that has yet to reach its full upside target.
Technical indicators on the daily time frame have turned bullish and show scope for further upside.
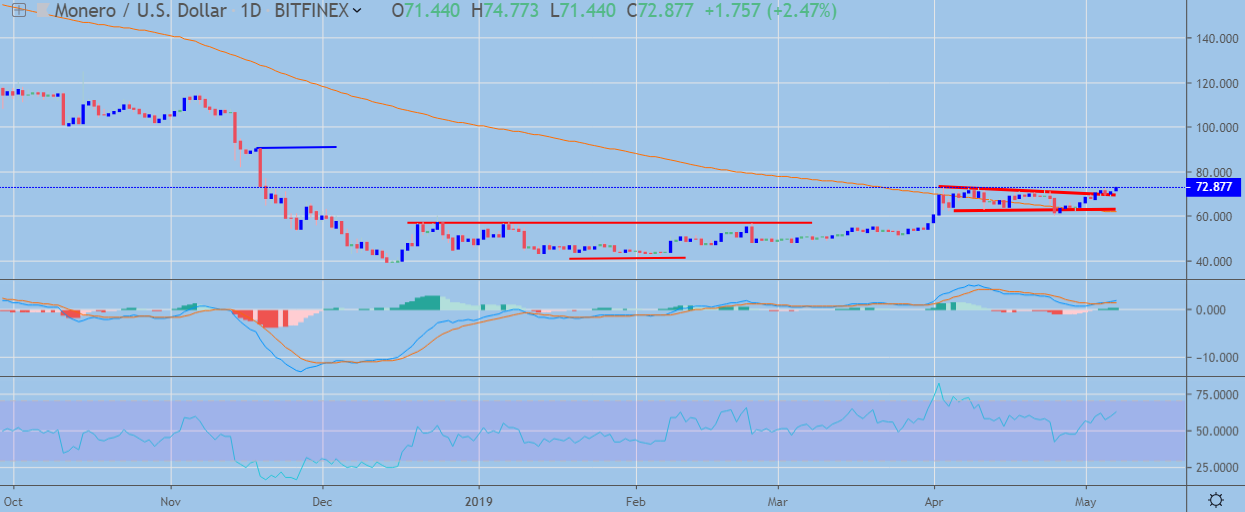 XMR / USD Daily Chart by TradingView
Pattern Watch
The daily time frame is showing that a bullish breakout from the descending wedge pattern is currently underway.
Relative Strength Index
The RSI indicator has turned bullish on the daily time frame and is highlighting growing buying interest.
MACD Indicator
The MACD indicator on the daily time frame has turned bullish with the MACD signal line issuing a buy signal.
Conclusion
Monero’s recent bullish technical breakout provides a clear indication that the XMR / USD pair can still trade much higher over the medium-term.
The bullish patterns on both the four-hour and daily time frame suggest that the cryptocurrency may soon start to target towards the November 19th, 2018 trading high.
Get a quick look of the coin in our XMR guide.
A detailed Digital Asset Report for Monero is available here.
Share this article
