XRP Aims For Higher Highs, Faces Strong Resistance Ahead
Optimism behind Ripple's XRP has returned following after a week of unexpected gains.

Key Takeaways
- XRP entered an uptrend that has seen its price rise over 20% since the beginning of the week
- The sudden bullish impulse allowed the cross-border remittances token to test a key resistance level
- While breaking above this hurdle could send this altcoin to new yearly highs, a particular technical index spells trouble
Share this article
XRP looks ready to break out after a week of strong performance. Still, one technical index estimates a retracement before the cryptocurrency makes further gains.
XRP Sits At Pivotal Point
So far, Ripple’s XRP has enjoyed an impressive rally this week. The cross-border remittances token entered a bullish impulse that has seen its price rise over 20% since Monday. The upswing allowed this cryptocurrency to hit a significant resistance barrier that has previously prevented it from advancing further.
Indeed, XRP is currently testing the 200-day moving average. Based on the 1-day chart, turning this critical hurdle into support may ignite a state of FOMO among traders. If this were to happen, the international settlements token would likely climb towards mid-February’s high of $0.35.
Given the odds of a further advance, some institutional investors are starting to pull the trigger. Will Meade, the founder of a $1.4 billion hedge fund, recently took to Twitter to announce that he had purchased his first cryptocurrency—XRP.
The former project manager at Goldman Sachs confessed to having little to no knowledge about the cryptocurrency industry. Based on his understanding of financial markets, however, he believes that “a rising tide lifts all boats.”
https://twitter.com/realwillmeade/status/1280928501080735745?s=21
With the high levels of correlation in the cryptocurrency market, Meade’s outlook may prove to be right. Regardless, the Tom Demark (TD) Sequential indicator suggests that XRP is bound for a correction before it finally breaks above its 200-day moving average.
A Pullback Before Higher Highs
This technical index is currently presenting a sell signal in the form of a green nine candlestick on XRP’s 12-hour chart. The bearish formation forecasts a one to four candlesticks correction before this altcoin can resume its uptrend.
A red two candlestick trading below a preceding red one candle can serve as confirmation of the pessimistic outlook. If validated, the selling pressure behind XRP may push its price down to test the 50% or 61.8% Fibonacci retracement levels.
These support walls sit at $0.19 and $0.185, respectively.
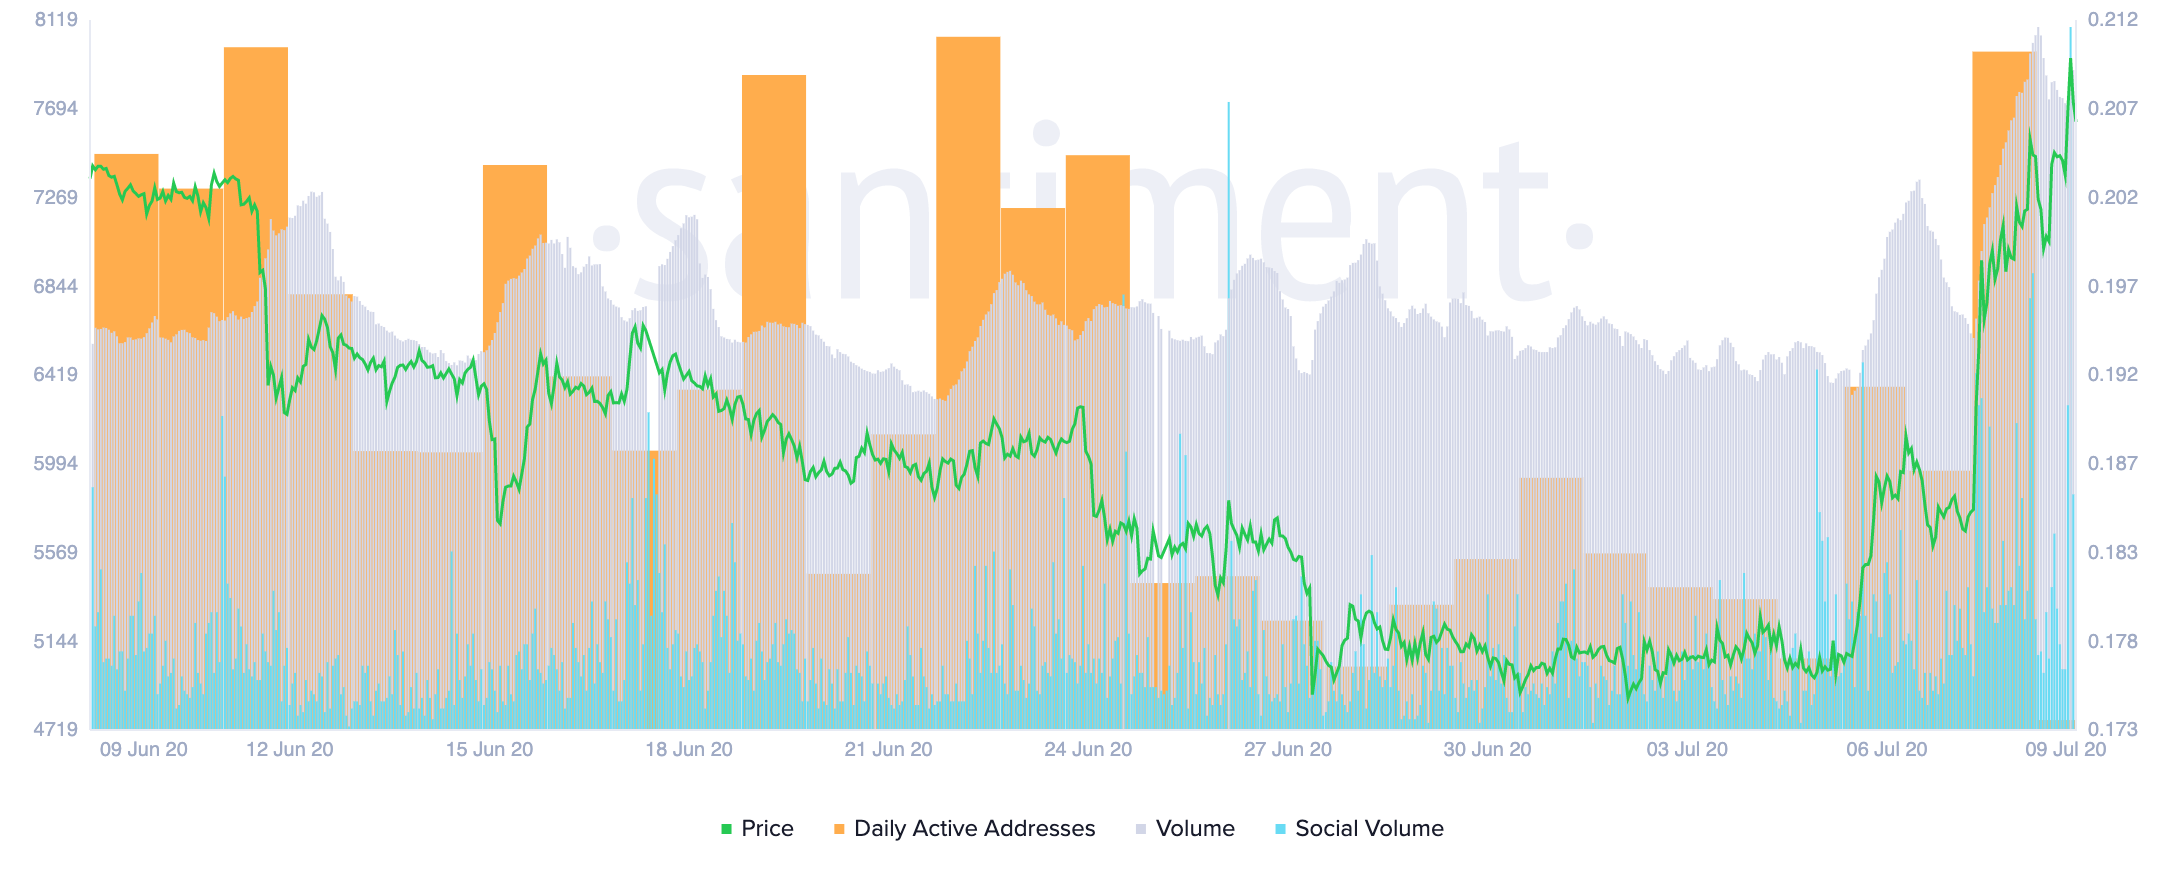
It is worth noting that while the TD setup estimates that a correction is underway, multiple key on-chain metrics are trending up.
XRP’s on-chain and social volume, as well as the number of daily active addresses, have been gaining upward momentum over the past week. These positive movements may soon be reflected in the price of this altcoin once the retracement is over.

Sidelined investors might take advantage of the potential retracement to re-enter the market. A new influx of capital would likely allow XRP to finally break above its 200-day moving average, which will translate into more gains.
Share this article
