Tezos / USD Technical Analysis: Steady Advance

Share this article
- Tezos is bullish in the short-term, with the cryptocurrency enjoying a strong intraday advance
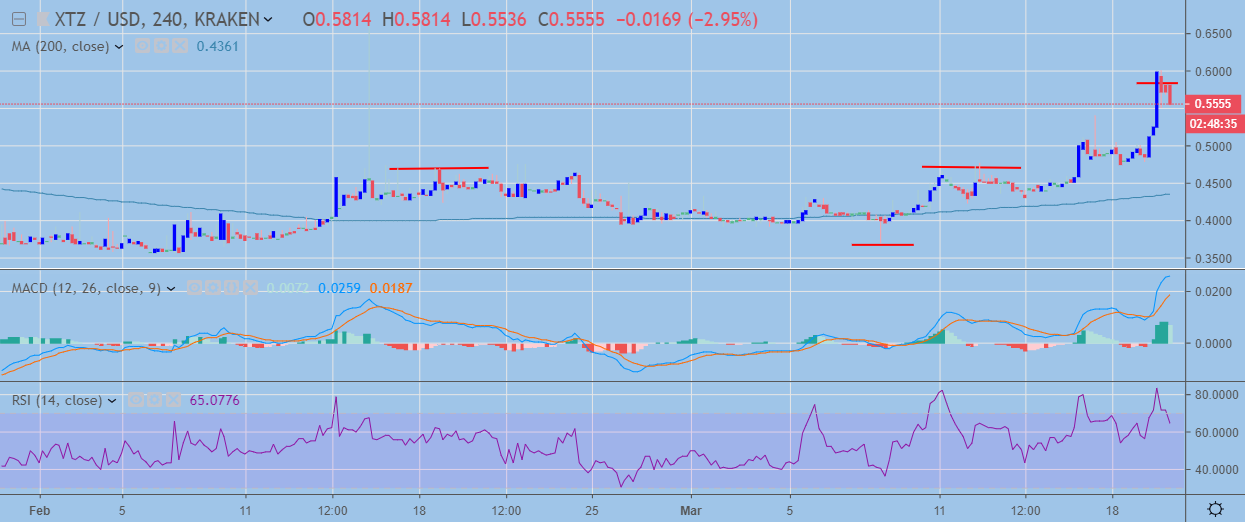
- The four-hour time frame shows that the bullish inverted head and shoulders pattern has now reached its upside objective
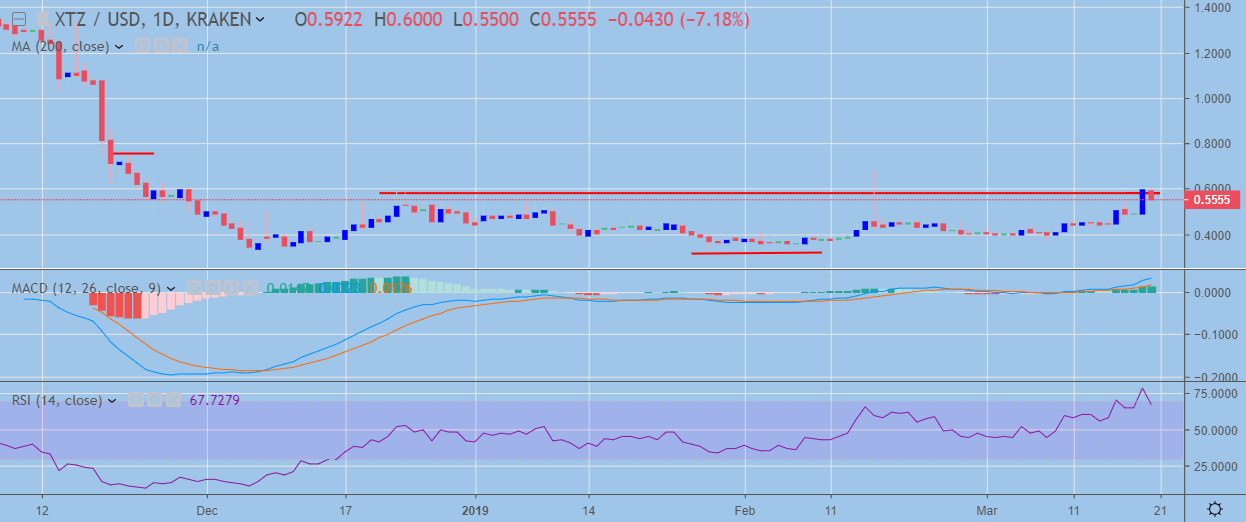
- The daily time frame highlights an even larger inverted head and shoulders pattern
Tezos / USD Short-term price analysis
Tezos is bullish over the short-term, with the cryptocurrency trading well above its key 200-period moving average on the four-hour time frame.
The recent bullish breakout has ignited a bullish inverted head and shoulders pattern on the four-hour time frame, with the upside movement reaching the overall upside objective of the pattern.
Technical indicators on the four-hour time frame suggest a bearish reversal could occur, with the March 17th spike high offering near-term support.

XTZ / USD H4 Chart (Source: TradingView)
Pattern Watch
If a strong technical correction does occur, the neckline of the inverted head and shoulders pattern offers the strongest form of short-term support.
MACD Indicator
The MACD indicator is currently conflicted on the four-hour time frame, with the MACD histogram turning lower, while the MACD signal line remains bullish.
RSI Indicator
The Relative Strength Indicator is bullish on the four-hour time frame, although bearish pressures are building.
Tezos / USD Medium-term price analysis
Tezos has a bullish medium-term outlook, with the cryptocurrency trading well above all key moving averages on the daily time frame. Furthermore, the recent advance in the XTZ / USD pair has created a large inverted head and shoulders pattern on the daily time frame.
If a bullish breakout were to occur above the neckline of the bullish inverted and shoulders pattern on the daily time frame, the XTZ / USD pair could advance towards levels not seen since November 20th last year.

XTZ / USD Daily Chart (Source: TradingView)
Pattern Watch
The February 16th trading high currently offers the strongest form of technical resistance above the neckline of the bullish pattern.
MACD Indicator
The MACD indicator has turned bullish on the daily time frame and is generating a strong buy signal.
RSI Indicator
The Relative Strength Index is bullish on the daily time frame, although the indicator is currently correcting from overbought conditions.
Conclusion
Tezos is growing increasingly bullish over both time horizons, with the emergence of the inverted head and shoulders pattern on the daily time frame the latest sign that the XTZ / USD pair could trade substantially higher over the medium-term.
Until price has stabilized above the neckline of the larger inverted head and shoulders pattern, traders should be on guard for a technical correction lower.
Decentral Media, Inc., the publisher of Crypto Briefing, is not an investment advisor and does not offer or provide investment advice or other financial advice. Nothing on this website constitutes, or should be relied on as, investment advice or financial advice of any kind. Specifically, none of the information on this website constitutes, or should be relied on as, a suggestion, offer, or other solicitation to engage in, or refrain from engaging in, any purchase, sale, or any other any investment-related activity with respect to any transaction. You should never make an investment decision on an investment based solely on the information on our website, and you should never interpret or otherwise rely on any of the information on this website as investment advice. We strongly recommend that you consult a licensed investment advisor or other qualified financial professional if you are seeking investment advice on an investment.
Share this article
