Zcash Price Analysis: Bullish Opportunity

Share this article
- Zcash has a bearish short-term and medium-term trading bias
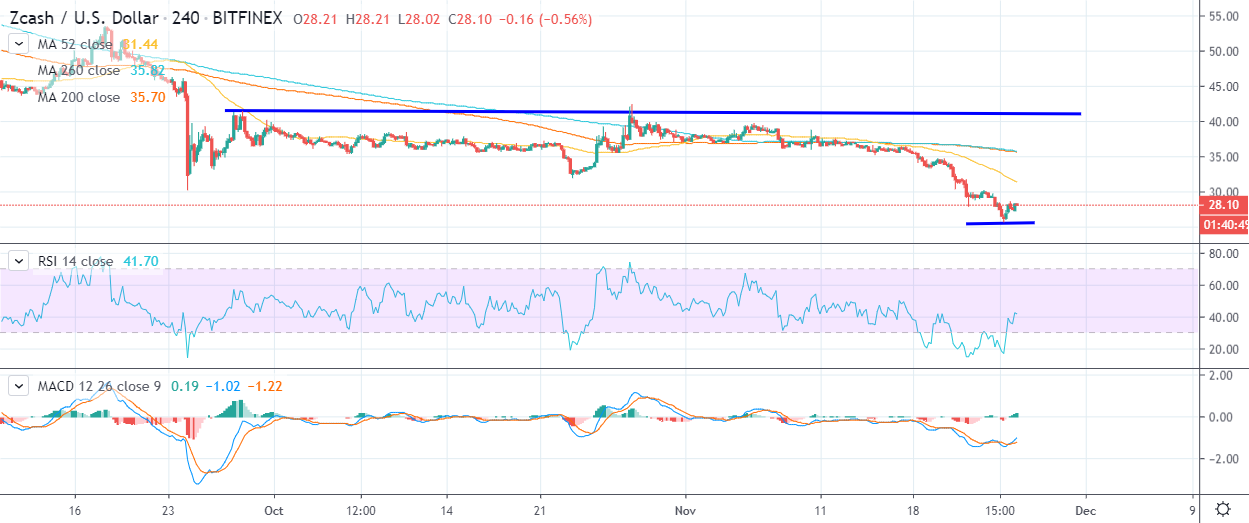
- The four-hour time frame shows that a bullish inverted head and shoulders pattern has been invalidated
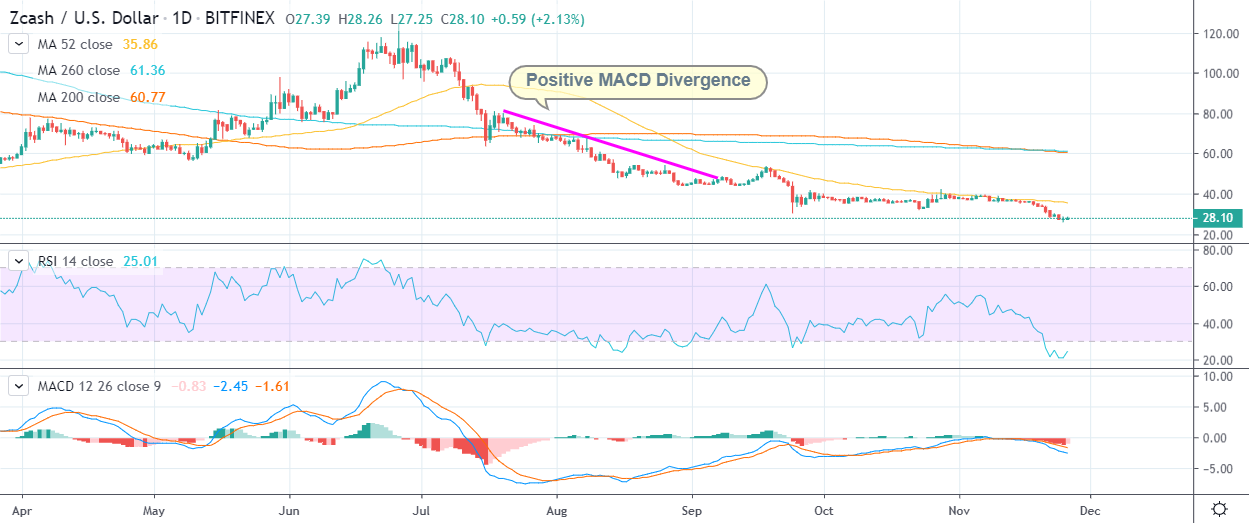
- The daily time frame shows the presence of bullish MACD divergence
Zcash has slipped to its lowest trading level since March 2019, following the recent decline in the broader cryptocurrency market which was sparked by bearish news coming from China’s central bank.
The ZEC/USD pair has fallen by over 30 percent since the start of November and 75 percent lower from its 2019 trading high.
Technical analysis suggests that the coin still has a high probability of staging a bullish reversal while trading above the important $17.00 level.
The four-hour time frame shows that an inverted head and shoulders pattern could start to form if buyers can stage a rally back toward the $40.00 level.
A price floor may have been established around $25 earlier this week, which is further complemented by a bullish reversal candle on the daily time frame.
The daily time frame also shows that large amount of bullish MACD price divergence appeared during the summer decline. The price divergence extends towards the $80.00 level.
Technical indicators are showing that a bullish reversal may be on the horizon, with the Relative Strength Index on the daily time frame reaching its most oversold level on record.
According to the latest sentiment data from TheTIE.io, the short-term sentiment towards Zcash is neutral at 42.00 %, while the overall long-term sentiment towards the cryptocurrency is neutral at 46.00%.
Upside Potential
The four-hour time frame shows that key technical resistance is located at the $35.00 and $40.00 levels. Buyers ideally need to rally price above them to form a large reversal pattern.
Key technical resistance over the medium-term is located at the $55.00 and $80.00 levels.
Downside Potential
The four-hour time frame is showing that the ZEC/USD pair has strong medium-term technical support around the $25.00 and $20.00 levels.
Critical long-term technical support for the ZEC/USD pair is located at the $17.00 level.
Summary
Zcash has suffered a heavy decline this week, further adding to the recent losses the cryptocurrency incurred over the summer.
The ZEC/USD pair now needs to recover towards the $40.00 level in order to form a large reversal pattern.
Share this article
