Zcash Price Analysis ZEC / USD: Sharp Bullish Breakout
A strong bullish breakout still retains some momentum.

Share this article
- Zcash has a bullish short-term trading bias, with the cryptocurrency advancing to its highest trading level since November 2018
- The four-hour time frame shows that a bullish breakout from a triangle pattern is underway
- The daily time frame is highlighting that a significant technical breakout has occurred
Zcash / USD Short-term price analysis
Zcash has a bullish short-term trading bias, with the ZEC / USD pair advancing to its highest trading level since November 2018.
The four-hour time frame is showing that a bullish breakout has occurred from a neutral triangle pattern, with the move higher yet to reach its full upside target.
Technical indicators across the four-hour time frame have turned bullish and are generating a strong bullish signal.
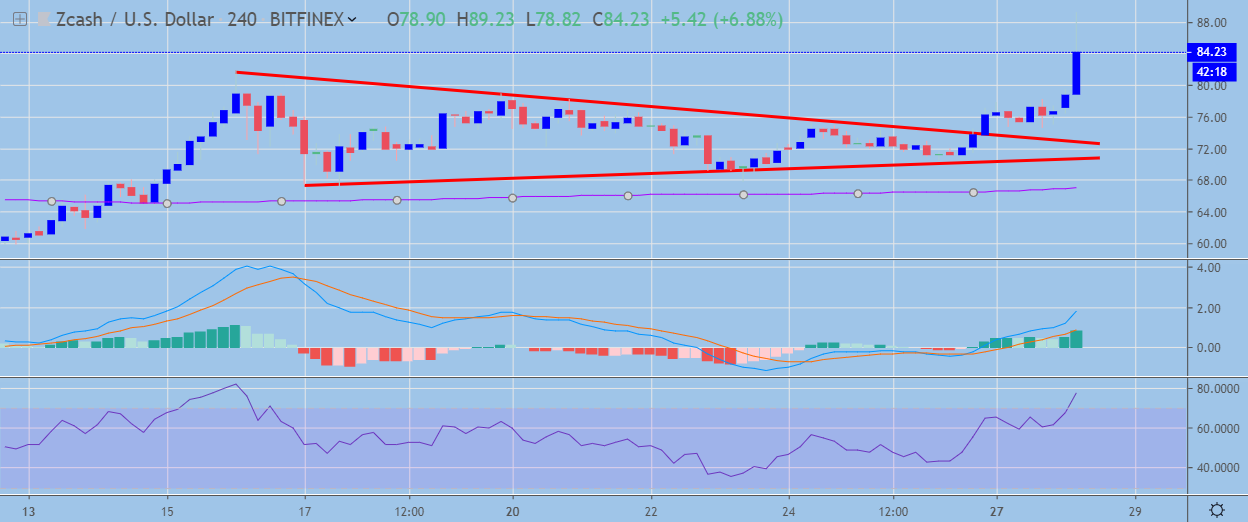 ZEC / USD H4 Chart by TradingView
Pattern Watch
Traders should note that a major range break has also taken place on the four-hour time horizon.
Relative Strength Index
The RSI indicator on the four-hour time frame is bullish, although it has moved into extreme overbought territory.
MACD Indicator
The MACD indicator on the four-hour time frame is bullish, with the MACD signal line and histogram issuing strong buy signals.
Zcash / USD Medium-term price analysis
Zcash has a strong bullish bias over the medium-term, with the ZEC / USD pair performing a major bullish breakout on the daily time frame.
The daily time frame is also showing that bulls have triggered a large inverted head and shoulders pattern, following the continued bullish breakout above the ZEC / USD pair’s 200-day moving average.
Technical indicators on the daily time frame remain bullish and still have scope to trade higher.
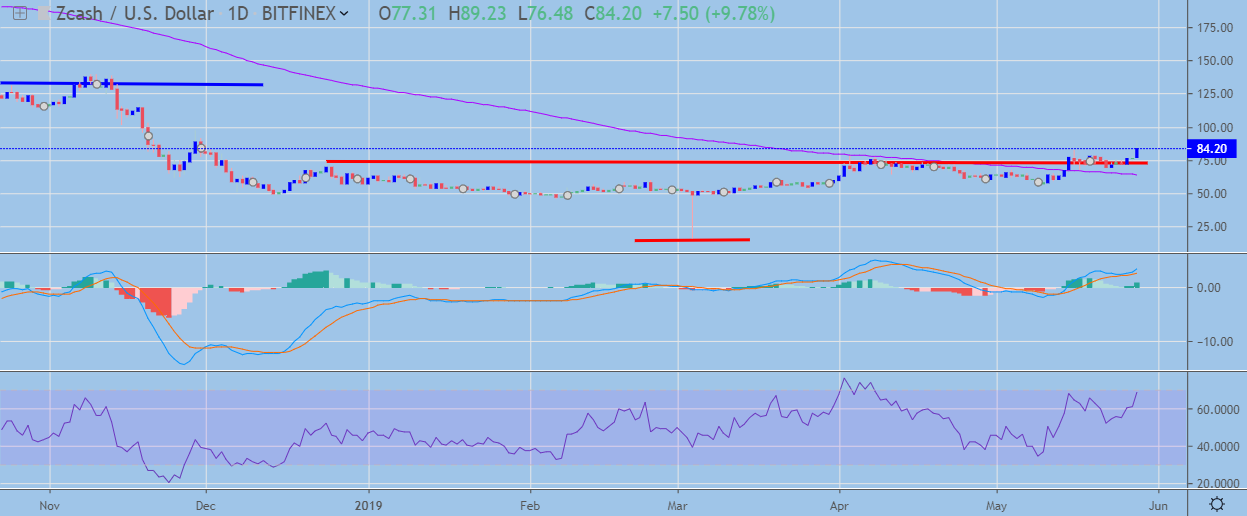 ZEC / USD Daily Chart by TradingView
Pattern Watch
Traders should note that the November 14th, 2018 swing-high is the initial upside target of the bullish inverted head and shoulders pattern on the daily time frame.
Relative Strength Index
The RSI indicator is bullish on the daily time frame, although it is now approaching overbought conditions.
MACD Indicator
The MACD indicator on the daily time frame is bullish and continues to issue a buy signal.
Conclusion
Zcash has staged an impressive technical breakout over both time horizons, with the cryptocurrency advancing to a new 2019 trading high.
While the breakout on the four-hour time frame is nearing completion, the bullish breakout on the daily time frame still appears to be in its early stages.
We published a quick coin guide to get started with the Zcash project.
On top of that, our analysts covered the project in depth in its Digital Asset Report.
Share this article
