Zcash Price Analysis ZEC / USD: Critical Level
ZEC could turn bullish, if it manages to break above its resistance level.

Share this article
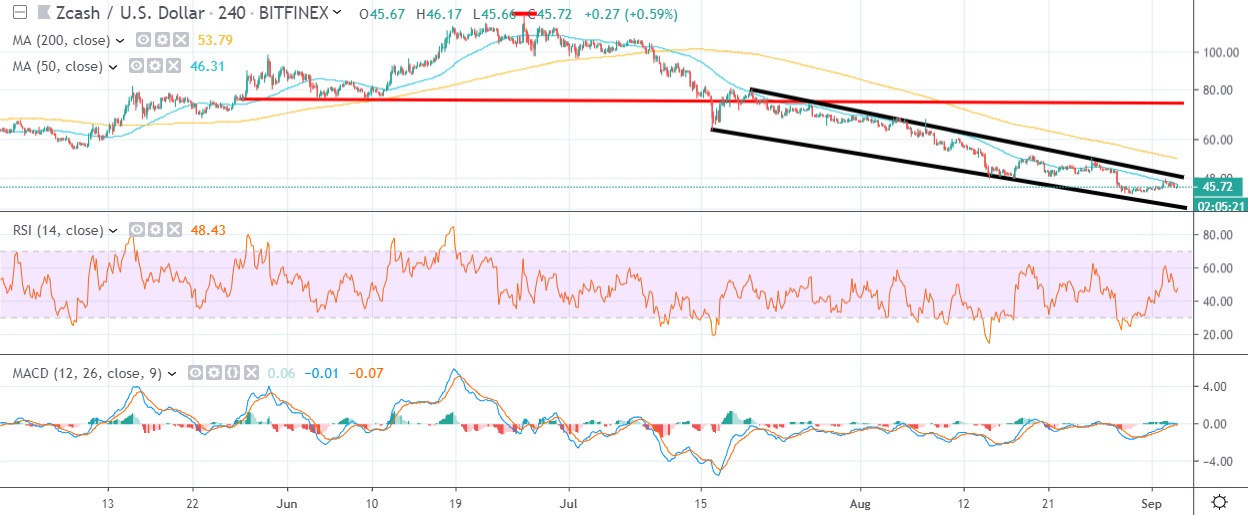
- Zcash is trapped within a large falling price channel on the four-hour time frame
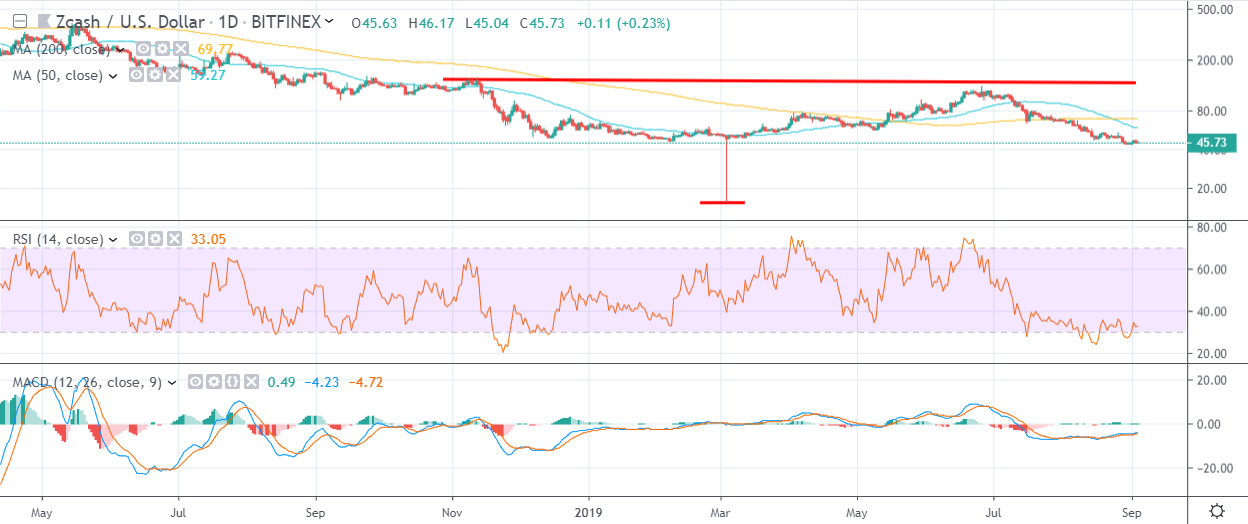
- The daily time frame highlights substantial amounts of positive MACD divergence
- A large inverted head and shoulders pattern is also present on the daily time frame
Zcash is starting to appear increasingly interesting from a technical perspective as the popular cryptocurrency trades at its weakest level since March 2019. Several technical indicators are suggesting that the ZEC / USD pair could soon stage a bullish reversal if buyers can hold price above the $44.00 level.
The ZEC / USD pair has suffered eight-straight weeks of losses and relinquished over fifty percent of its value since July this year. A bearish head and shoulders pattern has been rapidly unfolding, after sellers broke through the $75.00 level.
The overall size of the bearish head and shoulders pattern still suggests that Zcash could fall towards the $25.00 level. However, the decline has created sizeable amount of positive MACD divergence, which points to an eventual recover back towards the $80.00 level.
Furthermore, a large inverted head and shoulders pattern still remains dangerous and valid on the daily time frame while price trades above the $15.00 level. Overall size of the huge inverted head and shoulders pattern would take the ZEC / USD pair back towards the $200.00 level over the long-term.
With the cryptocurrency market showing signs of stabilizing in September, it may be time to start to look to Zcash to mount a sustainable recovery, although traders still need to be mindful that the cryptocurrency could still fall back toward the $25.00 support level, before staging a recovery over the medium to long-term.
According to the latest sentiment data from TheTIE.io, the short-term sentiment towards Zcash is extremely weak, at 19.00 %, while the overall long-term sentiment towards the cryptocurrency is neutral, at 58.00%.
Upside Potential
The four-hour time frame is showing that the ZEC / USD pair is trapped within a falling price channel. Bulls need to move price above the $50.00 level to break free from the price channel, with the $55.00 level the foremost resistance prior to the $67.00 level.
Bullish MACD price divergence extends back towards the $80.00 level, we should monitor this divergence potentially being eroded, if price breaks above the $50.00 level. A large reversal pattern could also form if price reaches the $80.00 level.
Downside Potential
The downside potential for the ZEC / USD pair could open-up dramatically if the $45.00 level is broken over the coming sessions. The bearish head and shoulders pattern on the four-hour time frame still suggests that the ZEC / USD pair could drop towards the $25.00 level.
From a long-term perspective, the $15.00 level is key, as it is the head of a huge inverted head and shoulders, and an area of critical technical importance.
Summary
The short-term technicals Zcash will become apparent once a breakout from the $45.00 to $50.00 price range occurs.
Overall, a sustainable recovery towards the $80.00 level can take place if we start to see the ZEC / USD pair breaking above the $50.00 resistance level.
Check out our coin guide for Zcash for a quick overview of the project.
A deeper dive is available in our DARE analytical report.
Share this article
