ZCash / USD Technical Analysis: Conflicting Outlook

Share this article
- ZCash is bullish in the short-term, although a near-term pullback looks likely
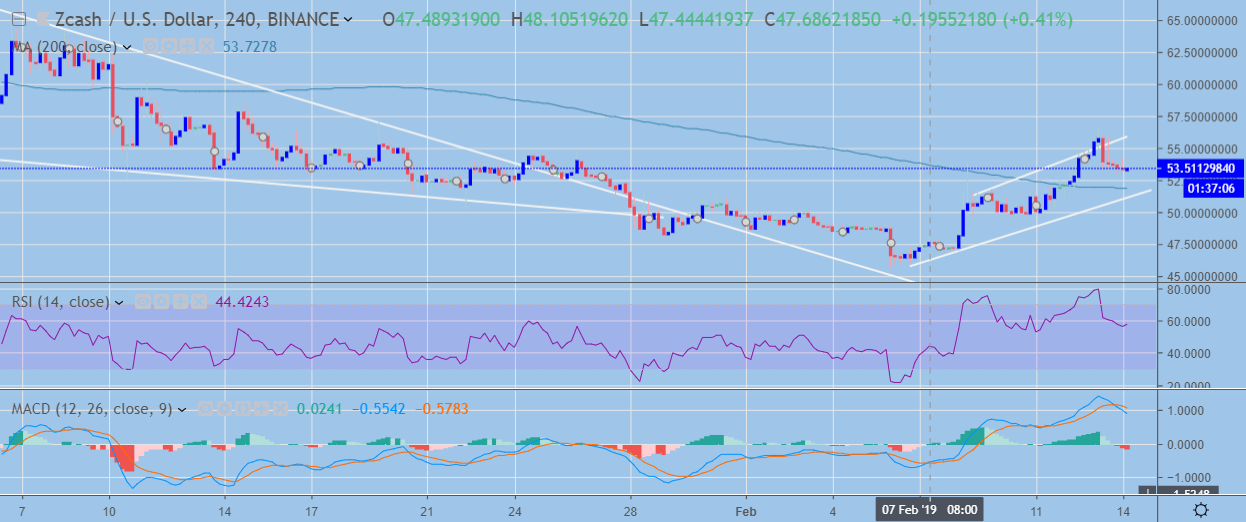
- ZEC / USD is trading within an ascending broadening wedge pattern on the four-hour time frame
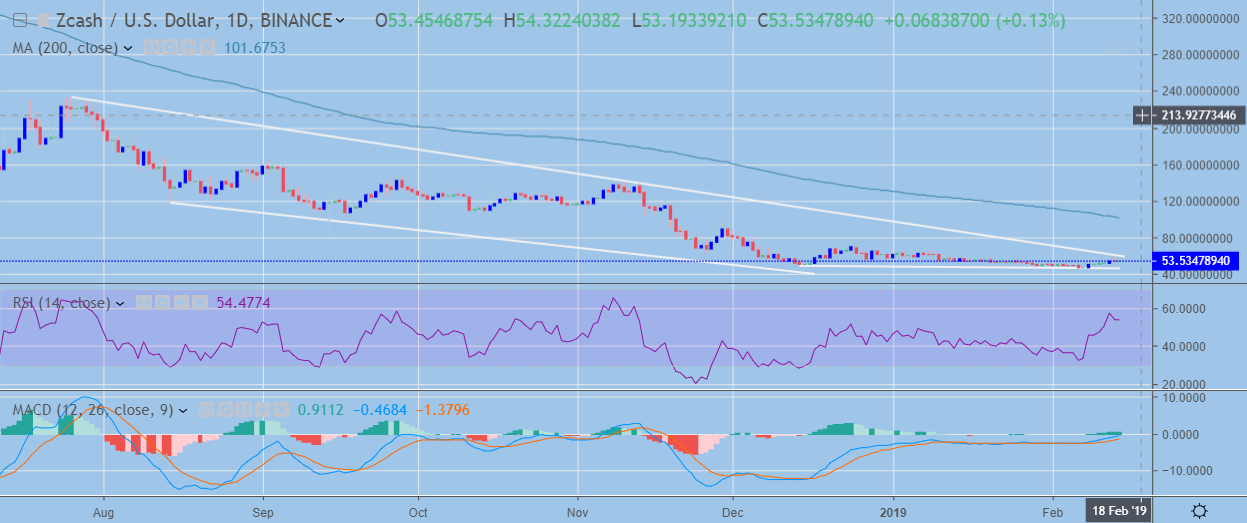
- Medium-term outlook is bearish with price still trapped within a descending price channel
ZEC / USD Short-term price analysis
In the short-term, ZCash is bullish, although the ZEC / USD pair could start to falter in the near-term, after buyers failed to keep price above a well-defined ascending broadening wedge pattern.
It is likely that the ZEC / USD pair will start to trade towards the bottom of the wedge pattern if we continue to see top-side failure.
Ascending Broadening Wedges patterns usually tend to break in the direction of the prevailing trend, so traders should be cautious of a potential downside breakout occurring.

ZEC / USD H4 Chart (Source: TradingView)
Pattern Watch
Traders should watch for the formation of a bullish inverted head and shoulders pattern if an upside breakout occurs in the short-term.
Key Moving Averages
The ZEC / USD pair’s 200 period moving average is now converging with the lower trendline on the ascending broadening wedge pattern; denoting a critical area of short-term support.
MACD
The MACD indicator has turned bearish on the four-hour time frame, which is in line with the recent move lower.
ZEC / USD Medium-term price analysis
In the medium-term, ZCash remains technically bearish with price trading well below the pair’s 200-day moving average, although price is moving closer to a major technical breakout.
The daily time frame is showing the ZEC / USD pair at a critical juncture, with price testing the upper trendline of a large descending price channel.
A bullish breakout would support a further move towards the pair’s 200-day moving average, while a bearish reversal will likely see the pair fall to fresh 2019 trading lows.

ZEC / USD Daily Chart (Source: TradingView)
Pattern Watch
Aside from the descending price channel, traders should note that ZCash still trades below the neckline of a large head and shoulder pattern on the daily time frame with further downside potential.
MACD + RSI
The MACD indicator on the daily time frame is turning bullish alongside the RSI indicator, which has recently enjoyed a strong upside break after remaining depressed since December last year.
Conclusion
ZCash is another cryptocurrency that is trading at a critical juncture, with the pair’s short-term outlook currently conflicting with its medium-term outlook.
Daily price closes around the descending price channel should be monitored closely, although traders should be wary of any false bullish breakouts given the protracted down trend that the ZEC / USD pair currently finds itself in.
Decentral Media, Inc., the publisher of Crypto Briefing, is not an investment advisor and does not offer or provide investment advice or other financial advice. Nothing on this website constitutes, or should be relied on as, investment advice or financial advice of any kind. Specifically, none of the information on this website constitutes, or should be relied on as, a suggestion, offer, or other solicitation to engage in, or refrain from engaging in, any purchase, sale, or any other any investment-related activity with respect to any transaction. You should never make an investment decision on an investment based solely on the information on our website, and you should never interpret or otherwise rely on any of the information on this website as investment advice. We strongly recommend that you consult a licensed investment advisor or other qualified financial professional if you are seeking investment advice on an investment.
Share this article
