Shutterstock cover by alberto clemares exposito
Zilliqa Joins Bull Market, Shatters Consolidation Phase
Zilliqa lools ready to resume its uptrend as its price breaks out of a bull flag.
After breaking out of a bullish flag and a month-long consolidation period, Zilliqa is primed for another leg up.
Further Gains on Zilliqa’s Horizon
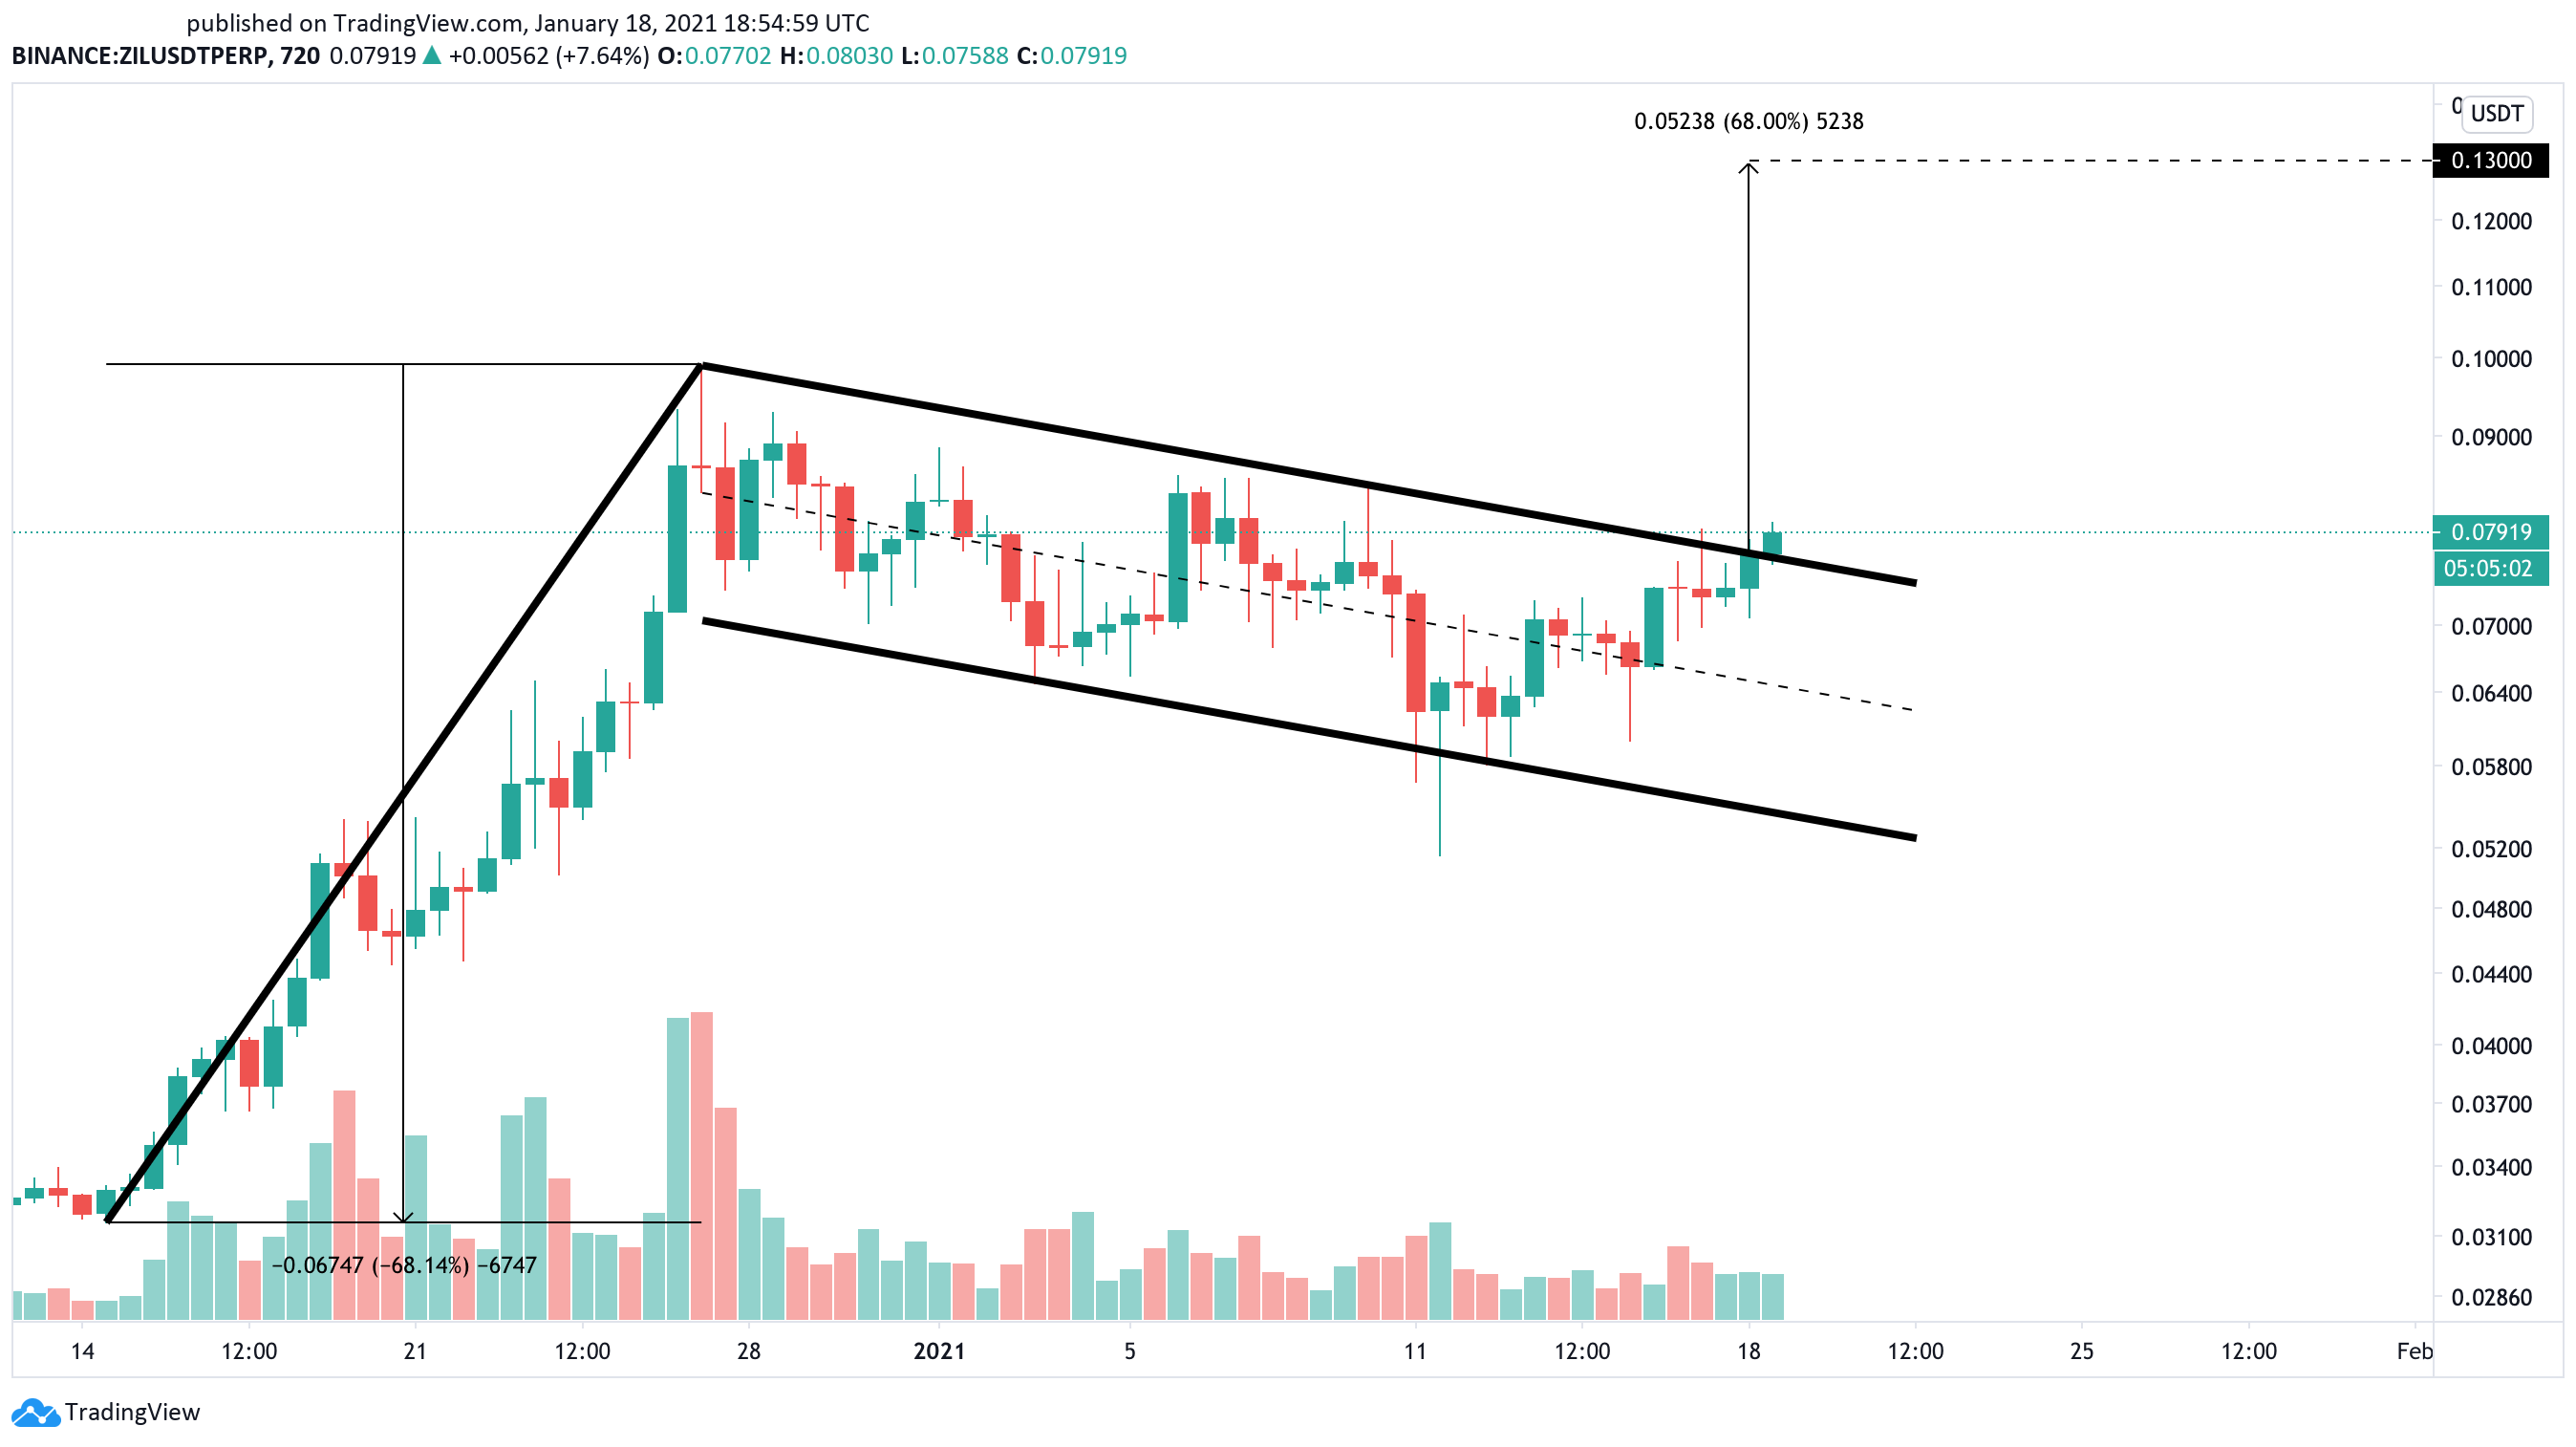
The 214% bull rally between Dec. 14 and Dec. 27 created the pattern’s flagpole. Meanwhile, the descending parallel channel that developed since then formed the pattern’s flag.
A recent spike in buying pressure allowed ZIL to slice through the flag’s upper trendline at $0.078, signaling a potential breakout.
If buy orders continue to pile up, Zilliqa’s market value could surge by nearly 70% towards $0.13. This target is determined by measuring the flagpole’s height and adding that distance to the breakout point.
The parabolic stop and reverse, or “SAR,” adds credence to the optimistic outlook. This trend-following indicator forecasts that Zilliqa’s downtrend reached exhaustion within the same time frame.
Each time the stop and reversal points move below an asset’s price, it is considered a positive sign. Thus, the recent flip over suggests that ZIL’s trend direction changed from bearish to bullish.
Historically, the stop and reversal system has been highly effective in determining the course of Zilliqa. The last two times the parabolic SAR flashed buy signals on the 12-hour chart, ZIL’s price surged by 14% and 95%, respectively.
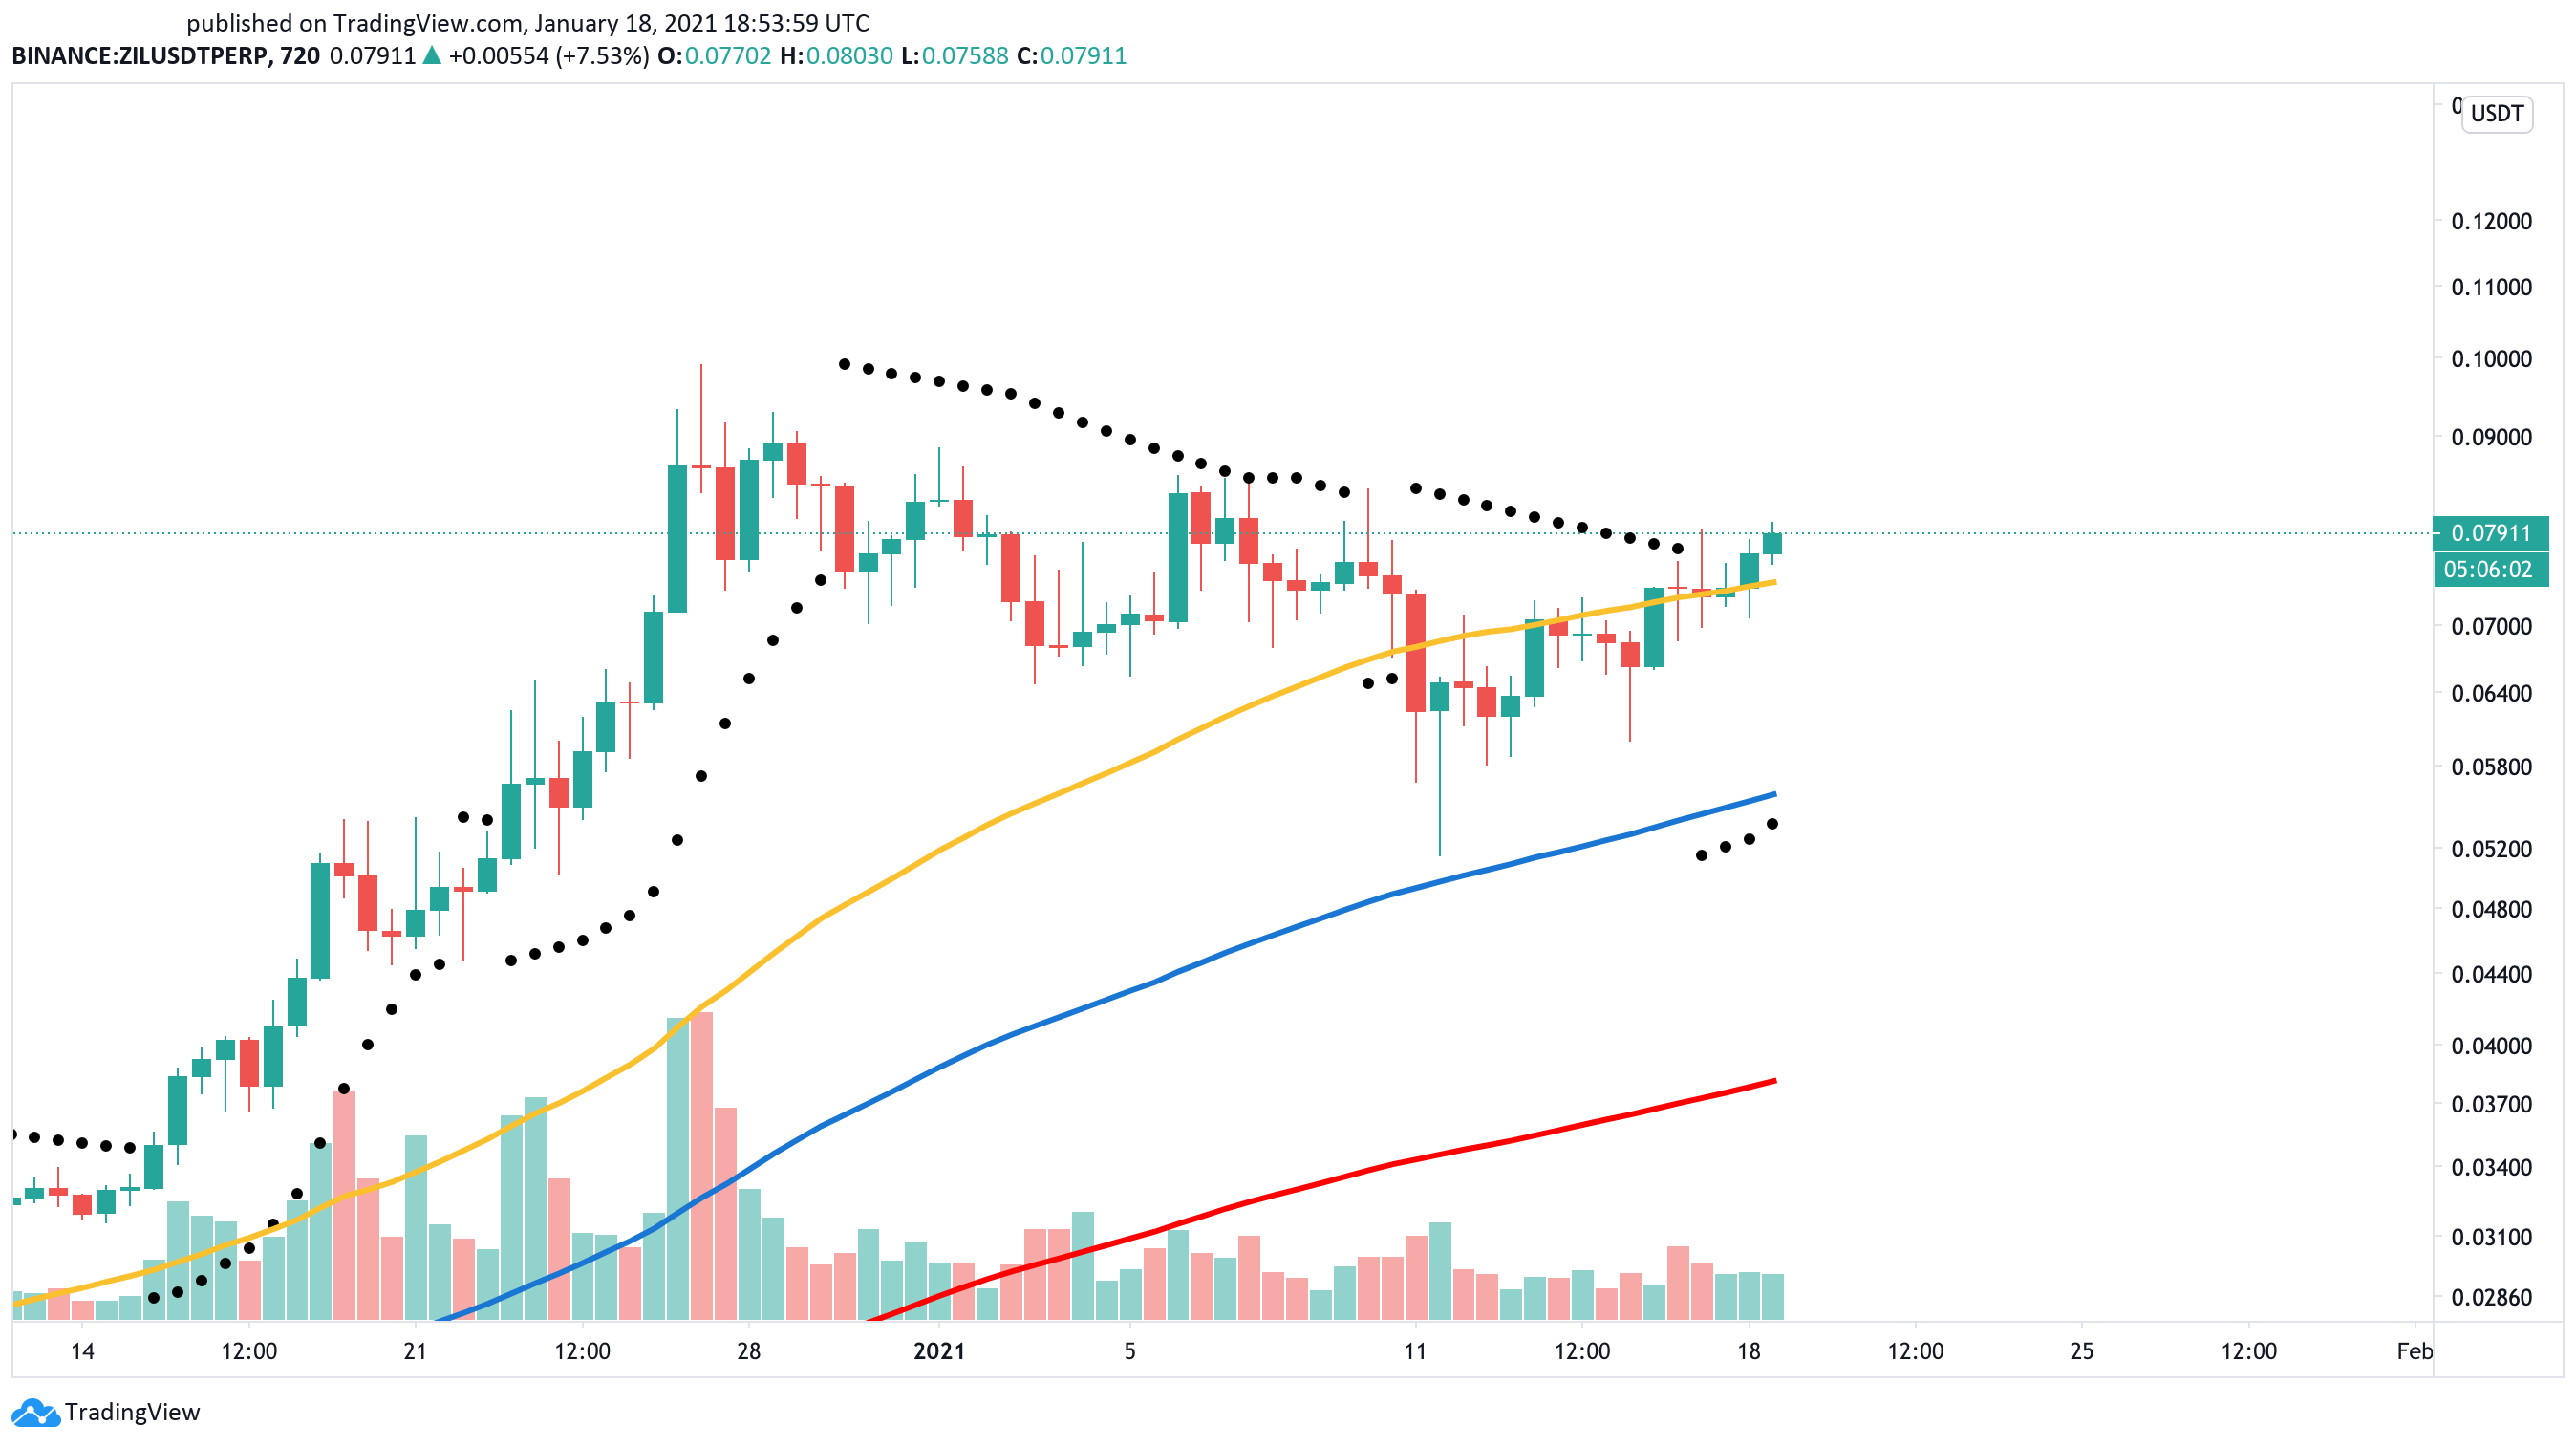
As long as the 50-twelve-hour moving average continues to hold, the optimistic outlook will remain intact. However, by slicing through this crucial support barrier, the odds will drastically increase for a significant correction.
If this were to happen, the 100- and 200-twelve-hour moving average would come into play. These interest areas currently hover around $0.056 and $0.038, respectively.
At the time of writing, this author held Bitcoin and Ethereum.