
Zilliqa Price Analysis ZIL / USD: Prison Break, Round 2
Zilliqa is still holding in a tight price channel.
- Zilliqa has a bullish short-term trading outlook, with the cryptocurrency still holding price above its 200-period moving average on the four-hour time frame
- The four-hour time frame continues to show a large inverted head and shoulders pattern
- The daily time frame is showing that the ZIL / USD pair is probing towards the top of its trading range
Fundamental Analysis
Zilliqa continues its move up after the project announced that it has enabled smart contracts. This opens the platform for a wide community of dApp developers, and could catalyze ecosystem growth with dApps development.
Zilliqa / USD Short-term price analysis
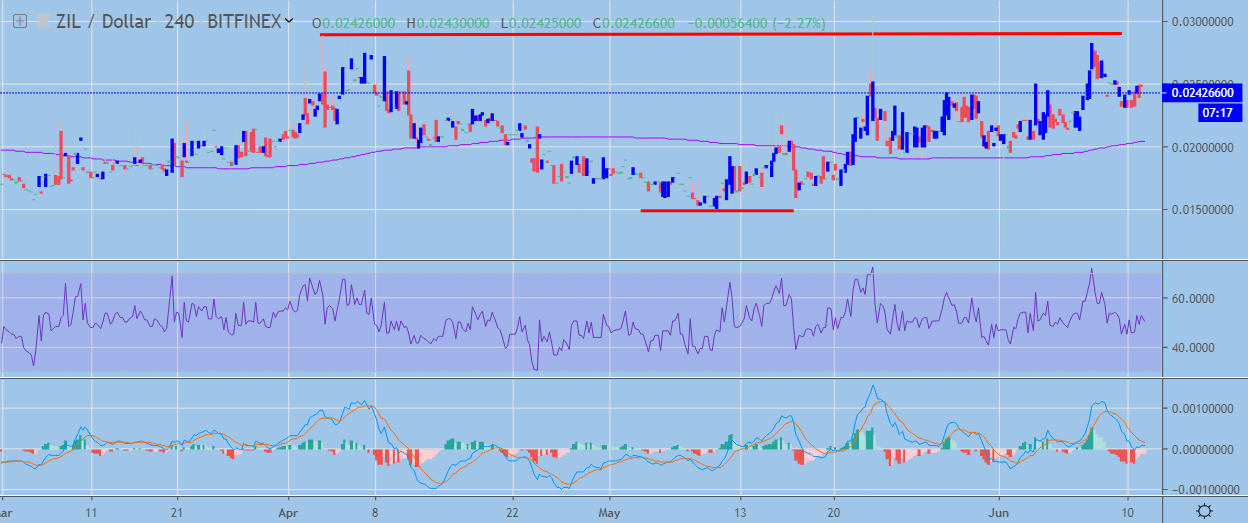
Zilliqa has a bullish short-term outlook, with the cryptocurrency still trading above its 200-period moving average on the four-hour time frame.
The four-hour time frame shows that a large inverted head and shoulders pattern has formed, with the ZIL / USD pair now slipping away from key neckline resistance.
Technical indicators across the four-hour time frame are neutral and are currently failing to generate a clear trading signal.
 ZIL / USD H4 Chart by TradingView
Pattern Watch
Traders should note the October 5th, 2018 swing-high is the overall upside target of the inverted head and shoulders pattern on the four-hour time frame.
Relative Strength Index
The RSI indicator is also neutral on the four-hour time frame and is highlighting the current indecision towards the ZIL / USD pair in the short-term.
MACD Indicator
The MACD indicator is neutral on the four-hour time frame and is failing to generate a clear trading signal.
Zilliqa / USD Medium-term price analysis
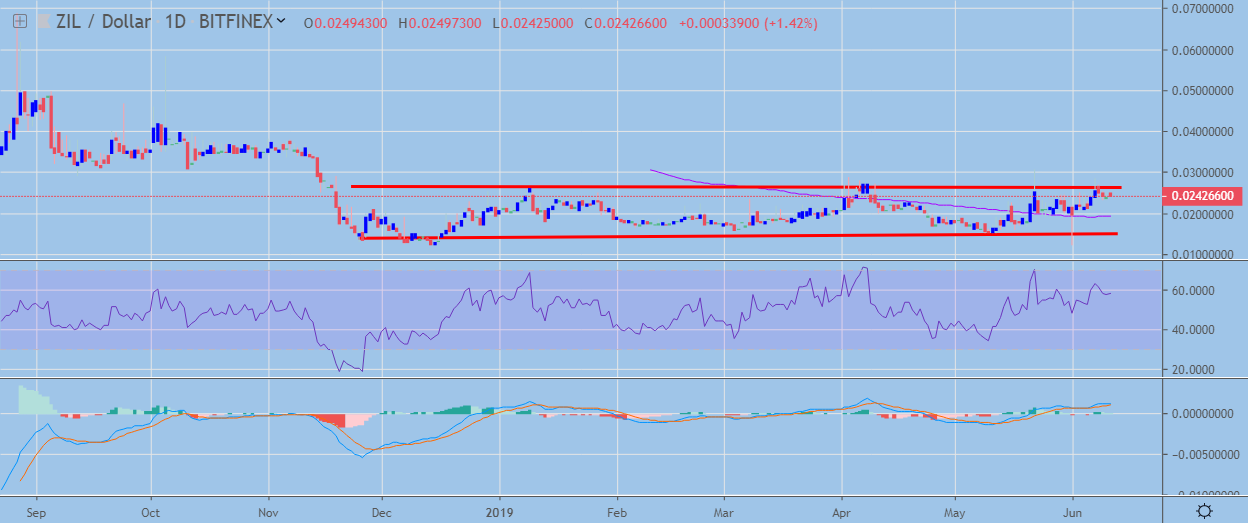
Zilliqa has a bullish medium-term outlook, with the cryptocurrency pressing against key trendline resistance on the daily time frame.
The daily time frame is showing that the ZIL / USD pair is now trading towards the top of a horizontal price channel, with bulls so far failing to perform a range breakout.
Technical indicators on the daily time frame remain bullish and continue drift higher.
 ZIL / USD Daily Chart by TradingView
Pattern Watch
Traders should monitor daily price closes above the horizontal price channel as it will likely signal a major sentiment shift towards the ZIL / USD pair.
Relative Strength Index
The Relative Strength indicator is bullish on the daily time frame and still shows scope for further upside.
MACD Indicator
The MACD indicator is bullish on the daily time frame and continues to generate a buy signal.
Conclusion
Zilliqa remains on the cusp of a technical breakout on both time horizons, with the recently created bullish pattern on the four-hour time frame highlighting the potential path ahead.
If a technical breakout fails to occur on the daily time frame, sellers may start to force the ZIL / USD pair back towards its 200-day moving average.
Check out our coin guide for Zilliqa for a brief overview.
We also published a deeper overview of the project in our Zilliqa DARE.