Zilliqa Price Analysis ZIL / USD: In The Bear’s Jaws
Strong downward breakouts are the most likely scenario for ZIL.

Share this article
- Zilliqa has a bearish short-term trading bias, with the cryptocurrency still trading below its 200-period moving average on the four-hour time frame
- The four-hour time frame shows that the ZIL / USD pair is attempting a bearish breakout from a wedge pattern
- The daily time frame continues to show a bearish technical breakout in action
Zilliqa / USD Short-term price analysis
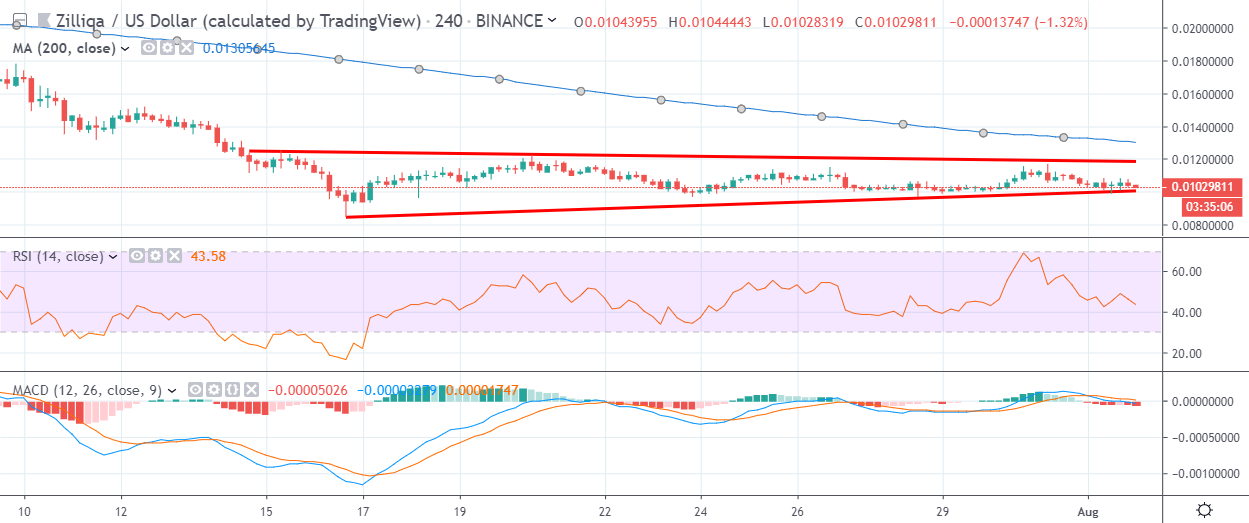
Zilliqa has a bearish short-term outlook, with the cryptocurrency still trading below its 200-period moving average on the four-hour time frame.
The four-hour time frame shows that the ZIL / USD pair is attempting a bearish breakout from narrowing wedge pattern that has been in play since mid-July.
Technical indicators across the four-hour time frame are bearish and continue to issue sell signals.
Pattern Watch
Traders should expect a double-digit move in the ZIL / USD pair once a confirmed technical breakout occurs.
Relative Strength Index
The RSI indicator is bearish on the four-hour time frame and still shows scope for further downside.
MACD Indicator
The MACD indicator is bearish on the four-hour time frame and continues to issue a sell signal.
Zilliqa / USD Medium-term price analysis
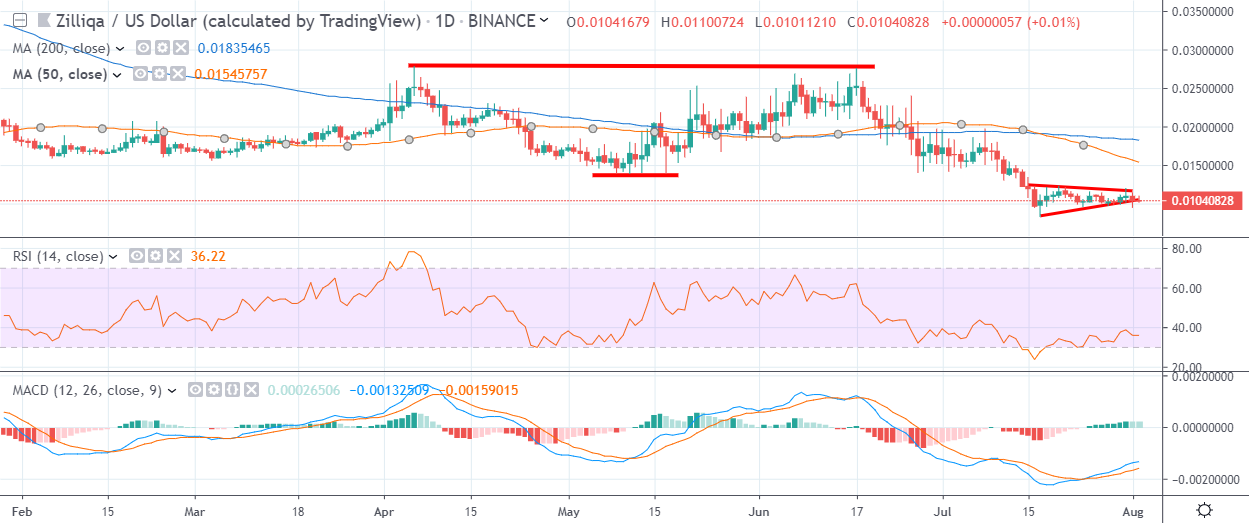
Zilliqa has a bearish medium-term outlook, with the cryptocurrency continuing to trade below key technical resistance on the daily time frame.
The daily time frame continues to show the invalidation of a large inverted head and shoulders pattern, which is a significant bearish development over the medium-term.
The 50-day moving average has now crossed below the 200-day moving average, which is a heavily bearish trading signal.
Pattern Watch
Traders should note that a neutral wedge pattern is also present on the daily time frame.
Relative Strength Index
The Relative Strength Index is rising on the daily time frame, although it remains technically bearish.
MACD Indicator
The MACD indicator is mixed on the daily time frame and is failing to provide a reliable trading signal.
Conclusion
Zilliqa may soon experience a strong technical breakout from the wedge pattern across both time horizons. Due to the overall bearish trend and the death cross in place on the daily time frame, a downward breakout is currently the preferred scenario.
Check out our coin guide for Zilliqa for a brief overview.
We also published a deeper overview of the project in our Zilliqa DARE.
Share this article
