 Earn with Nexo

ZRX / USD Price Analysis: Selling Pressure
Seven straight days of losses and the latest sell-off paint a bleak picture, but it could still recover.
- 0x has a bearish short-term outlook, with the cryptocurrency trading below its 200-period moving average on the four-hour time frame
- The four-hour time frame shows multiple bearish head and shoulders patterns
- The medium-term outlook for ZRX / USD is neutral, with the daily time frame still showing a large bullish pattern
ZRX / USD Short-term price analysis
0x has a bearish short-term outlook, with the cryptocurrency now trading back under its 200-period moving average on the four-hour time frame.
The four-hour time frame shows a series of head and shoulders pattern, with the ZRX / USD pair currently under downside pressure below key neckline support.
Technical indicators on the four-hour time frame are bearish and continue to generate a sell signal.
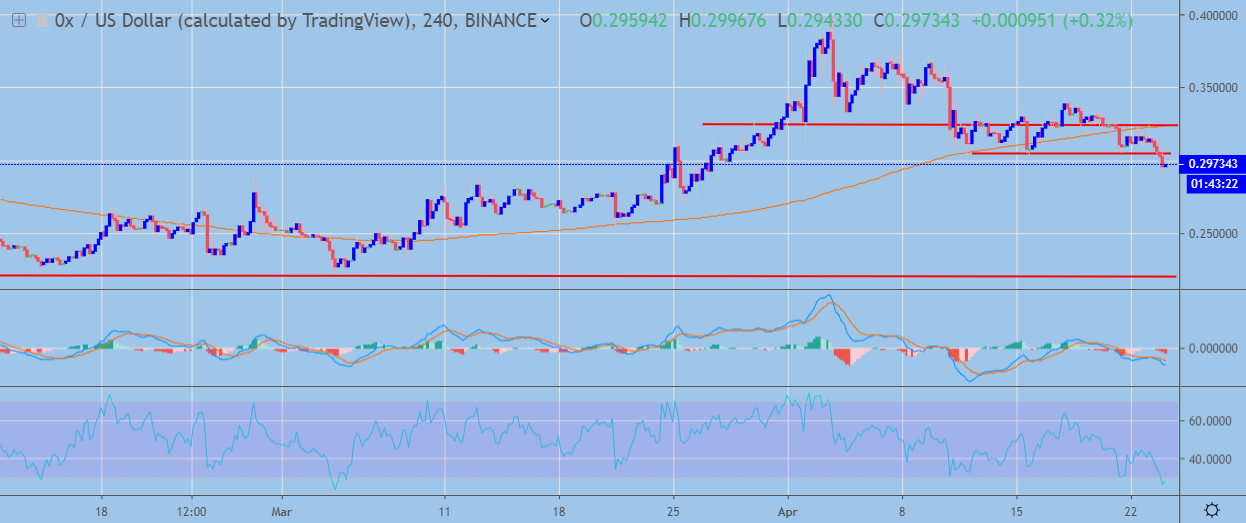 ZRX / USD H4 Chart by TradingView
Pattern Watch
Traders should note that if the decline in the ZRX / USD pair continues, a much larger head and shoulders pattern will take shape on the four-hour time frame.
Relative Strength Index
The RSI indicator is bearish on the four-hour time frame, although the indicator is trading close to oversold territory.
MACD Indicator
The MACD indicator has turned bearish on the four-hour time frame and is currently generating a sell signal.
ZRX / USD Medium-term price analysis
0x has a neutral medium-term outlook, with the cryptocurrency suffering seven straight days of losses and failing to build on the bullish momentum seen during the start of this month.
The daily time frame is currently showing a large inverted head and shoulders pattern that has yet to be invalidated by the recent decline.
Technical indicators on the daily time frame are pointing lower and show scope for further downside.
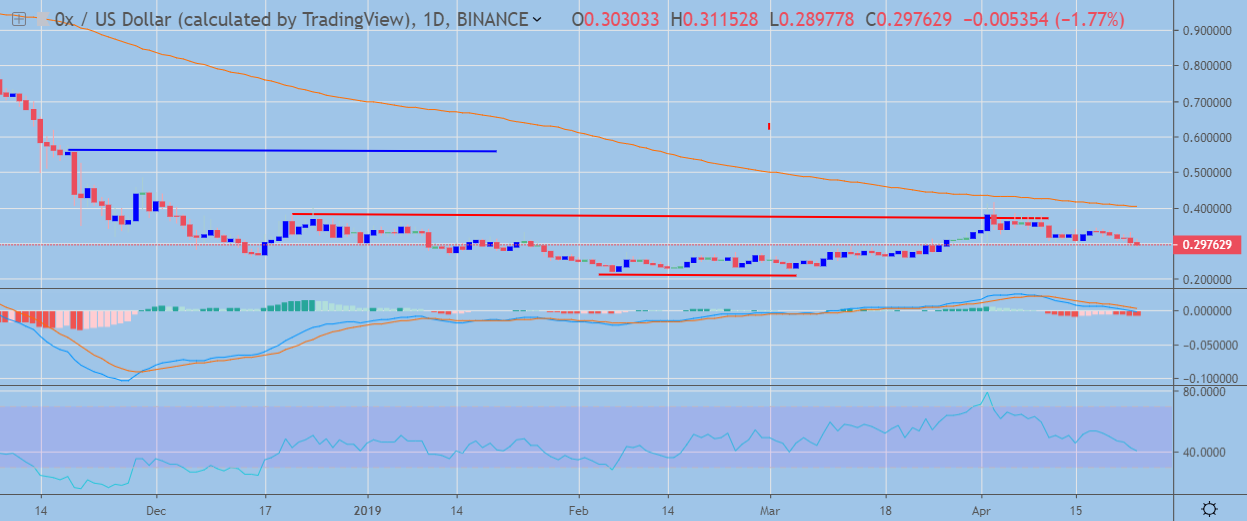 XLM / USD Daily Chart by TradingView
Pattern Watch
Traders should note that the ZRX / USD pair will target towards the November 19th, 2018 swing-high if the large inverted head and shoulder pattern is triggered on the daily time frame.
Relative Strength Index
The RSI indicator on the daily time frame is currently generating a strong sell signal.
MACD Indicator
The MACD indicator is also generating a sell signal, with the MACD signal line and MACD histogram both turning lower.
Conclusion
0x is coming under selling pressure in the short-term, with the bearish head and shoulders patterns on the four-hour time frame pressuring the ZRX / USD pair lower.
The presence of the large inverted head and shoulders pattern on the daily time frame still indicates that a much stronger upside move could occur over the medium-term. If sellers do invalidate the bullish pattern on the daily time frame, the cryptocurrency would then turn heavily bearish over the medium-term.
Check out our coin guide for XLM.
Our deep dive DARE into the project is available here.