
Basic Attention Token Price Analysis BAT / USD: The Razor’s Edge
The thin line between love and bait.
- Basic Attention Token has a bearish short-term trading bias, with the cryptocurrency trading under its 200-period moving average on the four-hour time frame
- The four-hour time frame shows that a bearish breakout is still underway from a neutral triangle pattern
- The daily time frame continues to show a head and shoulders pattern breakout in progress
Basic Attention Token / USD Short-term price analysis
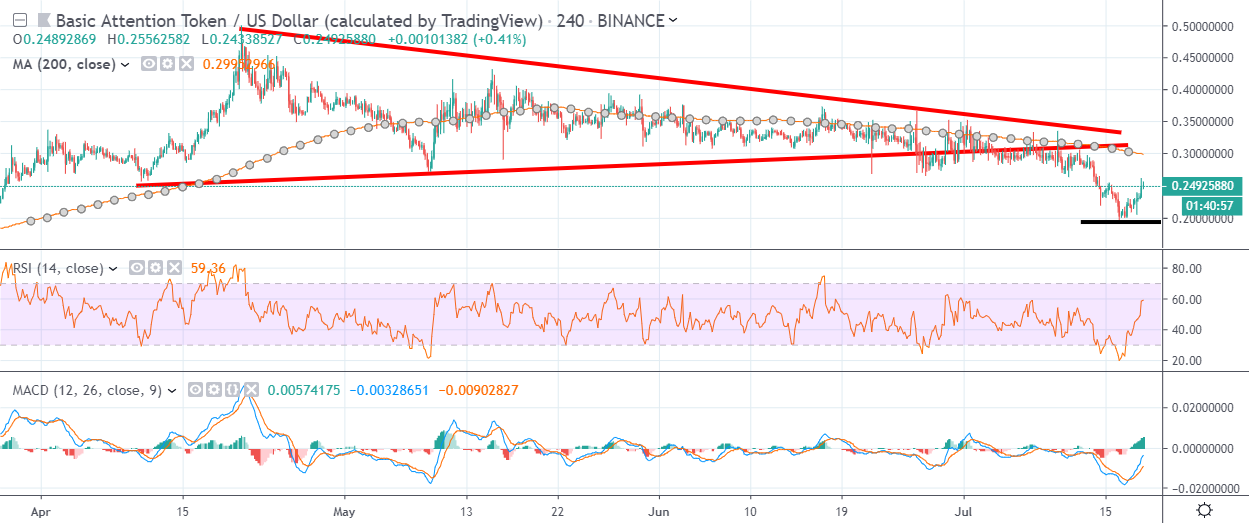
Basic Attention Token has a bearish short-term trading bias, with the BAT / USD pair trading under its 200-period moving average on the four-hour time frame.
The four-hour time frame shows that a bearish breakout is currently underway from a neutral triangle pattern. The breakout has yet to reach its overall downside target.
Technical indicators on the four-hour time frame are bullish and continue to generate a buy signal.
Pattern Watch
Traders should note that the 0.10000 level is overall full downside objective of the bearish triangle breakout.
Relative Strength Index
The RSI indicator on the four-hour time frame is also bullish and continues to issue a buy signal.
MACD Indicator
The MACD indicator has turned bullish on the four-hour time frame, with both the MACD signal line and histogram generating a buy signal.
Basic Attention Token / USD Medium-term price analysis
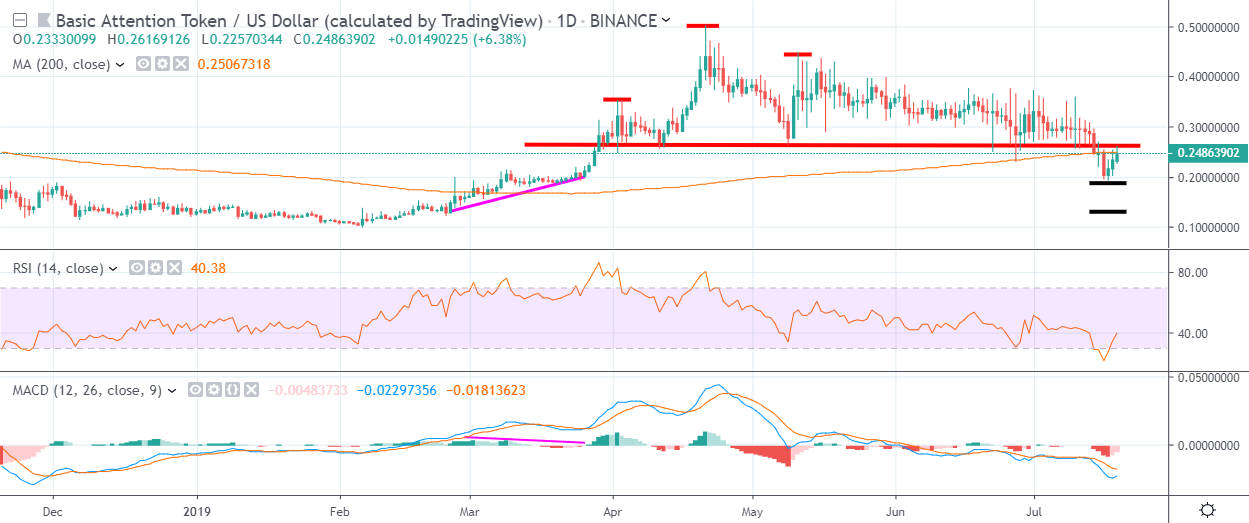
Basic Attention Token has a neutral medium-term bias, with the BAT / USD pair now testing back towards its 200-day moving average.
The daily time frame is showing that a bearish head and shoulders has been triggered, with the BAT / USD pair now testing back towards key neckline resistance.
Technical indicators on the daily time frame are turning lower and continue to issue sell signals. Bearish MACD price divergence is also present on the daily time frame.
Pattern Watch
Traders should note that the overall downside target of the bearish head and shoulders pattern would erode the presence of negative MACD price divergence on the daily time frame.
Relative Strength Index
The RSI indicator is bearish on the daily time frame, although it is currently correcting from oversold conditions.
MACD Indicator
The MACD indicator on the daily time frame is bearish and continues to show the presence of negative MACD price divergence.
Conclusion
Basic Attention Token is testing back towards the neckline of the bearish head and shoulders pattern on the daily time frame, as technical traders test the validity of the recent breakout.
Failure around current trading levels is likely to see sellers target the full downside projection of the head and shoulders pattern, which would also erode the presence of any negative MACD divergence on the daily time frame.
Head over to our coin guide for BAT and the Brave Browser for an intro to the project.
Also, an in-depth dive into BAT is available in our DARE.