 Earn with Nexo

Basic Attention Token BAT / USD Price Analysis: Emerging From The Depths
BAT / USD Technical Analysis:
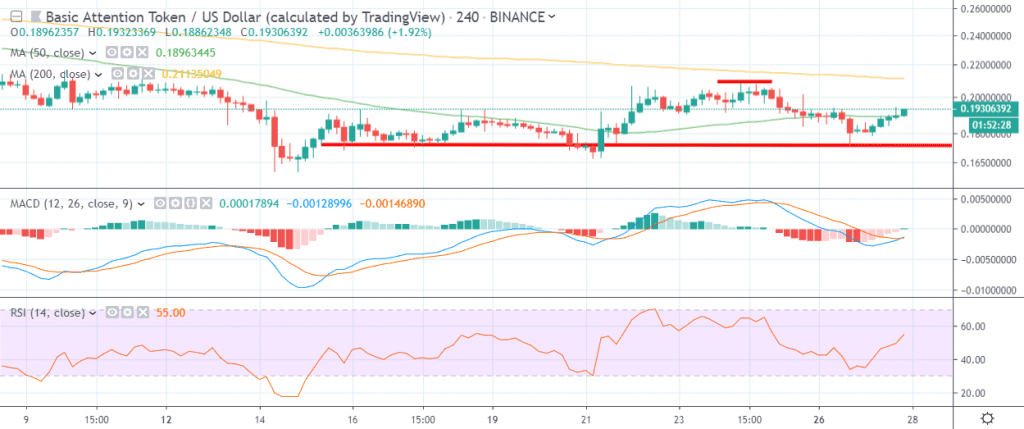
- The four-hour time frame shows a bearish head and shoulders pattern building
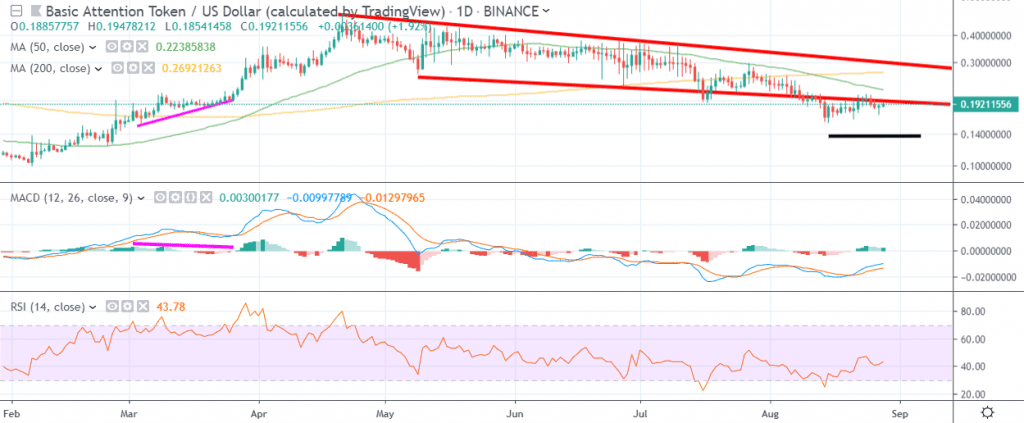
- The daily time frame continues to show large amounts of negative MACD price divergence
Basic Attention Token is attempting to recover short-term bullish momentum on Wednesday as the cryptocurrency probes back towards the August 25th swing-high. The BAT / USD pair has been a notable underperformer in the cryptocurrency space this year, and has suffered a tumultuous fall since peaking around the $0.500000 level in April.
At current trading levels, Basic Attention is down over sixty percent from its 2019 price peak, but the cryptocurrency has gained an encouraging thirty percent since the start of the year. Technical analysis shows that the cryptocurrency turned bearish during mid-July, after slipping back under its 200-day moving average.
The MACD indicator on the daily time frame suggests that the BAT/USD pair may fall back towards its yearly opening price, as a significant amount of negative divergence still exists. The bearish MACD price divergence was created during the strong move higher in early March 2019.
The four-hour time frame shows that a head and shoulders pattern is forming. If the bearish pattern is triggered, the overall downside projection of the pattern will override the bearish MACD divergence, which could mark a turning point for the cryptocurrency.
According to the latest sentiment data from TheTIE.io, the short-term sentiment towards Basic Attention is neutral, at 48.00 %, while the overall long-term sentiment towards the cryptocurrency is bullish, at 65.00%.
Upside Potential
The four-hour time frame is showing that bulls need to move the BAT / USD pair above the 0.210000 level to negate the previously mentioned bearish head and shoulders pattern. The 200-period moving average on the four-hour time frame is also converging around the head of the bearish pattern.
The daily time frame highlights that a bearish death-cross is currently underway, with the 50-day moving average crossing over the 200-day moving average. Bulls need to move price above the 0.22100 level to negate the death-cross.
Downside Potential
The downside potential for the BAT/USD pair is focused around the neckline of the bearish head and shoulders pattern on the four-hour time frame. The neckline of the pattern is found at the $0.175000 level, while the current monthly low is located just below the neckline, at $0.161000.
The daily time frame highlights that bearish MACD price divergence extends down towards the $0.140000 level, which is interestingly the same overall target of the bearish pattern on the four-hour time frame.
Summary
Basic Attention is attempting to recover from a six-month trading low, although the technical outlook for the cryptocurrency still appears very bearish. Technical analysis suggests that the BAT/USD pair could fall further, with the $0.140000 level the immediate bearish target.
Head over to our coin guide for BAT and the Brave Browser for an intro to the project.
Also, an in-depth dive into BAT is available in our DARE.