 Earn with Nexo

Basic Attention Token Price Analysis BAT / USD: Looming Bears
Large bearish patterns are weighing on BAT.
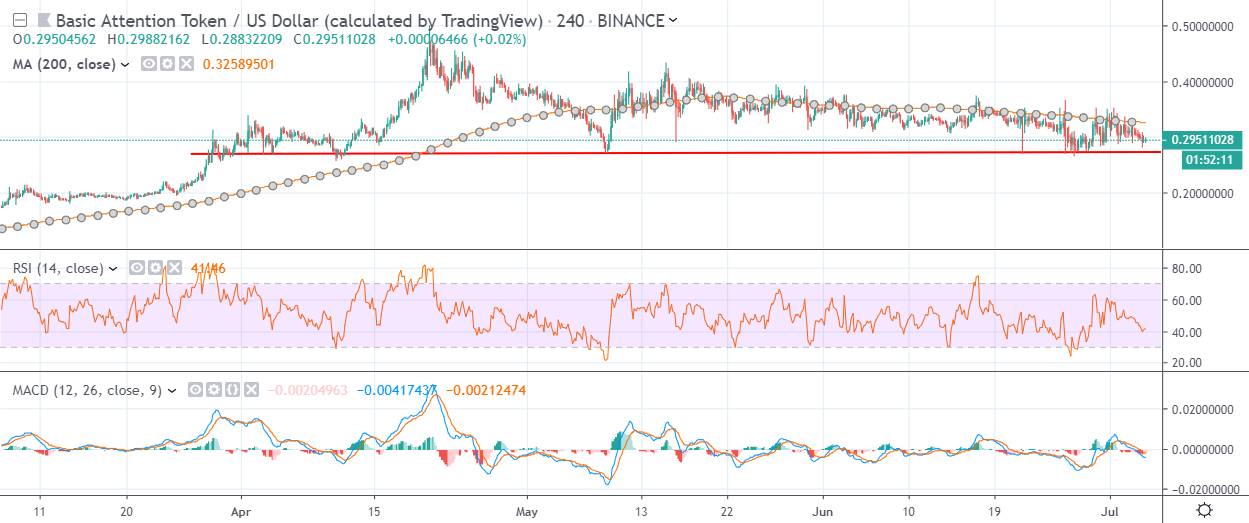
- Basic Attention has a bearish short-term trading bias, with the cryptocurrency now trading below its 200-period moving average on the four-hour time frame
- The four-hour time frame shows the presence of a bearish head and shoulders pattern
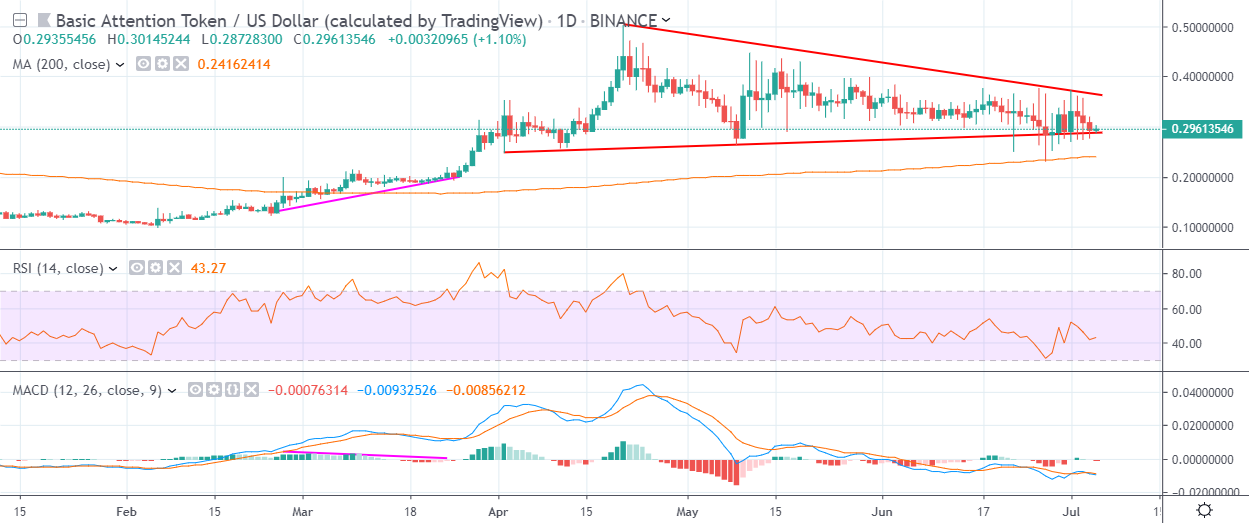
- The daily time frame highlights that a neutral triangle pattern has formed
Basic Attention Token / USD Short-term price analysis
Basic Attention has a bearish short-term trading bias, with the BAT / USD pair trading under its 200-period moving average on the four-hour time frame.
The four-hour time frame is currently showing a valid head and shoulders pattern, with BAT / USD sellers attempting to break the neckline of the bearish pattern.
Technical indicators on the four-hour time frame are bearish and continue to generate a sell signal.
Pattern Watch
Traders should note that the BAT / USD pair will erode close to forty percent of its value if the bearish head and shoulders pattern reaches its full downside objective.
Relative Strength Index
The RSI indicator on the four-hour time frame is bearish and continues to highlight the growing short-term selling pressure.
MACD Indicator
The MACD indicator is bearish on the four-hour time frame and is currently generating a strong sell signal.
Basic Attention Token / USD Medium-term price analysis
Basic Attention has a bullish medium-term outlook, with the BAT / USD pair still holding price above major technical support on the daily time frame.
The daily time frame is showing that a triangle pattern has now taken shape, with BAT / USD sellers attempting to move price under the neutral pattern.
Technical indicators on the daily time frame are bearish and continue to issue a sell signal.
Pattern Watch
Traders should await multiple daily price closes above or below the triangle pattern for confirmation that a valid technical breakout has occurred.
Relative Strength Index
The RSI indicator has turned bearish on the daily time frame and continues to issue a sell signal.
MACD Indicator
The MACD indicator on the daily time frame is bearish and continues to show the presence of bearish MACD divergence.
Conclusion
Basic Attention is coming under downside pressure across both time frames, with a bearish head and shoulders pattern looming large over the BAT / USD pair on the four-hour time frame.
The presence of negative MACD divergence on the daily time frame may finally be reversed if sellers receive confirmation of a bearish breakout.
Head over to our coin guide for BAT and the Brave Browser for an intro to the project.
Also, an in-depth dive into BAT is available in our DARE.