 Earn with Nexo

Basic Attention Token Price Analysis BAT / USD: Pressed Down
BAT is not ready to pitch upwards yet.
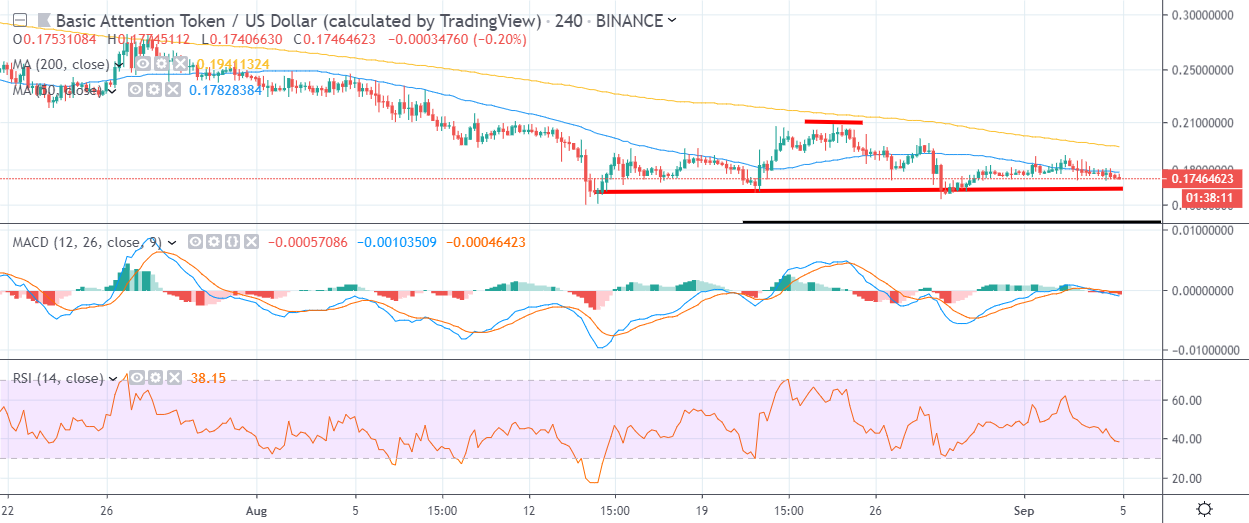
- The four-hour time frame shows a bearish head and shoulders pattern forming
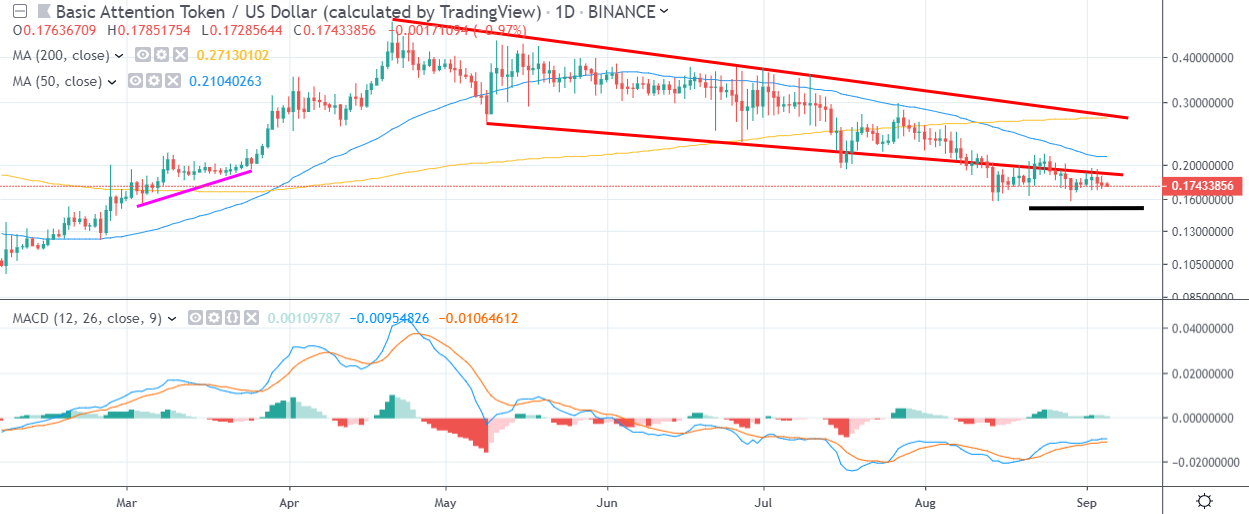
- The daily time frame highlights negative MACD price divergence extending down to the 0.150000 level
- Basic Attention Token has broken below a long-time price channel on the daily time frame
Basic Attention Token is still showing few signs of recovery as the cryptocurrency languishes towards its lowest trading level since March this year. Several technical indicators and price patterns are suggesting that the BAT / USD pair has further room to run lower and is not yet oversold.
The BAT / USD pair peaked on April 21st this year, with the popular crypto’s losses accelerating during early June. At current trading levels, the BAT / USD pair has lost over sixty-five percent of its value since from its yearly trading high, and trades around forty percent higher from the start of the year.
Looking ahead, technical analysis suggests that the cryptocurrency still has further to fall before it may start to begin a meaningful reversal. Firstly, the four-hour time frame shows a valid head and shoulders pattern, with the pattern holding a downside projection that would take the BAT / USD pair towards the $0.110000 level.
The daily time frame also projects further losses for the BAT / USD pair, with three obvious negative developments happening on this time frame. Firstly, a bearish death-cross is underway, while a bearish channel breakout is also in progress. The mentioned time frame also shows negative MACD price divergence that extends down towards the $0.150000 level.
The RSI indicator on the daily time frame also shows that the cryptocurrency is not yet oversold, despite suffering four-straight months of declines.
According to the latest sentiment data from TheTIE.io, the short-term sentiment towards Basic Attention Token is positive, at 63.00 %, while the overall long-term sentiment towards the cryptocurrency matches the daily sentiment, at 63.00%.
Upside Potential
The four-hour time frame is showing that the BAT / USD pair needs to break above the 0.208000 level to negate the bearish head and shoulders pattern on the mentioned time frame. The 0.270000 level is the foremost resistance area if a bullish breakout does occur.
The daily time frame mirrors the four-hour time frame in terms of key technical levels, with key trendline resistance at the 0.208000 level, while the BAT / USD pair’s 200-day moving average is located at the 0.270000 level.
Downside Potential
The head and shoulders pattern on the four-hour time frame dominates the technicals on the lower time frames, with the 0.168000 level the neckline and breakout point for the bearish pattern.
The daily time frame currently shows a bearish death-cross unfolding, with the 50-day moving average crossing over the 200-day moving average. The negative MACD price divergence extends down towards the 0.150000 level.
Summary
The short-term technicals for Basic Attention Token suggest a move towards at least the $0.150000 level, while medium-term analysis is even more bearish, and points to a drop towards the $0.110000 level.
Overall, the BAT / USD pair shows few signs of making a sustainable recovery, heightening the chances of further downside for the cryptocurrency.
Head over to our coin guide for BAT and the Brave Browser for an intro to the project.
Also, an in-depth dive into BAT is available in our DARE.