
Basic Attention Token Price Analysis BAT / USD: Failing To Support
Basic Attention Token is now trading below its moving averages.
- Basic Attention Token has a bearish short-term trading bias, with the cryptocurrency now trading below its 200-period moving average on the four-hour time frame
- Basic Attention Token has a negative medium-term outlook, with price now creating bearish lower lows
- Bearish MACD price divergence remains present on the daily time frame
Basic Attention Token / USD Short-term price analysis
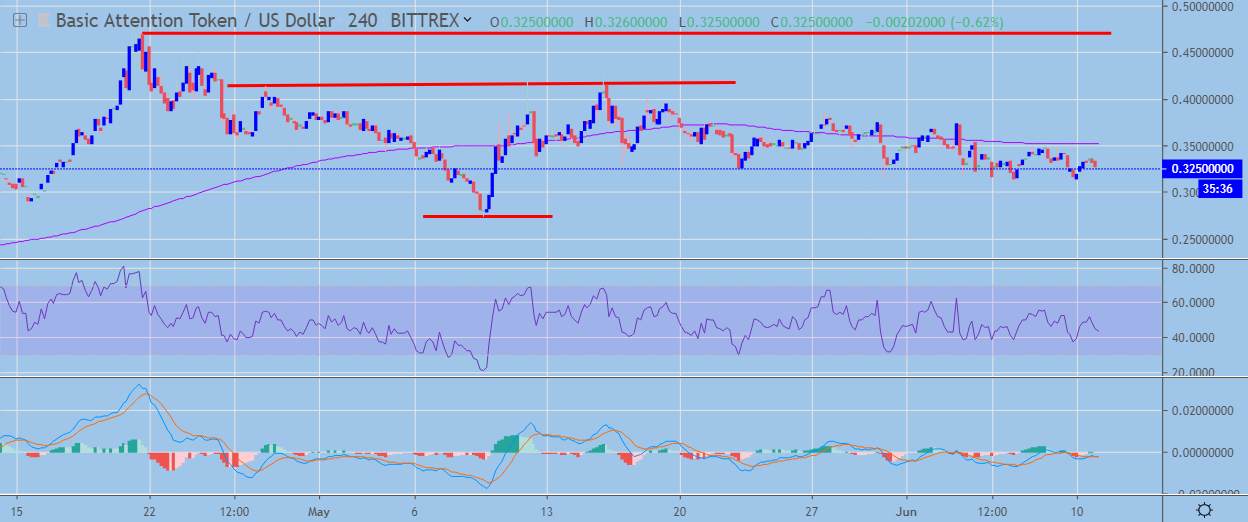
Basic Attention Token has a bearish short-term trading bias, with the BAT / USD pair now trading below its 200-period moving average on the four-hour time frame.
The four-hour time frame is currently showing an inverted head and shoulders pattern, with BAT / USD sellers working hard to invalidate the bullish pattern.
Technical indicators on the four-hour time frame are bearish and continue to turn lower.
 BAT / USD H4 Chart by TradingView
Pattern Watch
Traders should note that the BAT / USD pair will experience heavy technical selling if bears invalidate the inverted head and shoulders pattern on the daily time frame.
Relative Strength Index
The RSI indicator on the four-hour time frame is bearish and continues to track price lower.
MACD Indicator
The MACD indicator has a neutral bias on the four-hour time frame and is currently failing to generate a clear trading signal.
Basic Attention Token / USD Medium-term price analysis
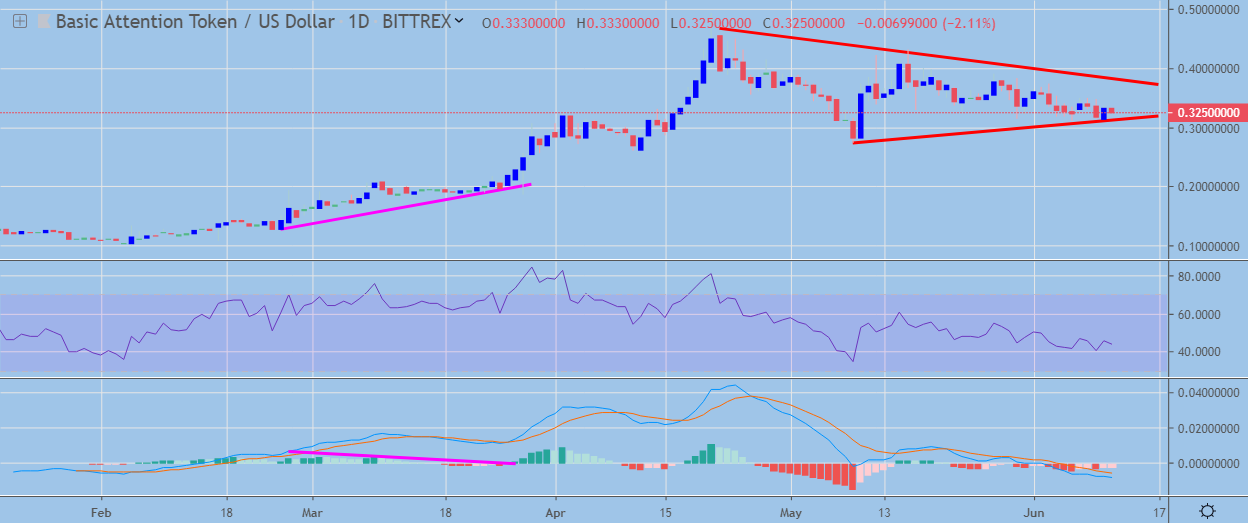
Basic Attention Token has a bearish medium-term bias, with the BAT / USD pair falling back towards major technical support on the daily time frame.
The daily time frame is showing that a neutral triangle pattern has taken shape, with sellers now attempting to force price under critical trendline support.
Technical indicators remain bearish on the daily time frame and continue to issue a sell signal.
 BAT / USD Daily Chart by TradingView
Pattern Watch
Traders should note that a large head and shoulders pattern will form on the daily time frame if a bearish breakdown below key technical support occurs.
Relative Strength Index
The RSI indicator has turned bearish on the daily time frame and shows scope for further downside.
MACD Indicator
The MACD indicator on the daily time frame is currently issuing a sell signal and continues to show bearish MACD divergence.
Conclusion
Basic Attention Token has an increasingly negative outlook across both time horizons, with the cryptocurrency edging closer to a major technical breakdown.
If sellers can force the BAT / USD pair below key trendline support, we may see a strong decline and the bearish MACD divergence on the daily time frame reversed.
Head over to our coin guide for BAT and the Brave Browser for an intro to the project.
Also, an in-depth dive into BAT is available in our DARE.