 Earn with Nexo

Basic Attention Token / USD Technical Analysis: Third Peak
The pair is looking bullish overall, but if the recent rally fails to move it over its November high, it could turn bearish.
- Basic Attention Token has a bullish short-term trading bias, with price trading at its highest level since November 2018
- The BAT / USD pair’s medium-term outlook remains bullish, with price trading above its 200-day moving average
- Bearish MACD divergence is present on the four-hour and daily time frames
Basic Attention Token / USD Short-term price analysis
Basic Attention Token has a bullish short-term trading bias, with the BAT / USD pair now trading at its highest level since November 8th, 2018.
An inverted head and shoulders pattern is present on the four-hour time frame, with BAT / USD buyers testing towards the neckline of the bullish pattern.
Bearish MACD price divergence remains present on the four-hour time frame and extends back towards the start of the March 2019 rally.
 BAT / USD H4 Chart by TradingView
Pattern Watch
Traders should note that the upside projection of the inverted head and shoulders pattern would take the BAT / USD pair towards levels not seen since May 2018.
Relative Strength Index
The RSI indicator on the four-hour time frame is also bullish and steadily rising.
MACD Indicator
The MACD indicator on the four-hour time frame is bullish, although bearish price divergence is still evident.
Basic Attention Token / USD Medium-term price analysis
Basic Attention Token has a bullish medium-term outlook, with the BAT / USD pair now trading above its 200-day moving average since early March this year.
The daily time frame shows that a bearish triple-top pattern will start to form if buyers fail to move the BAT / USD pair above the November 8th swing-high.
Similar to the four-hour time frame, bearish MACD price divergence is also seen on the daily time frame.
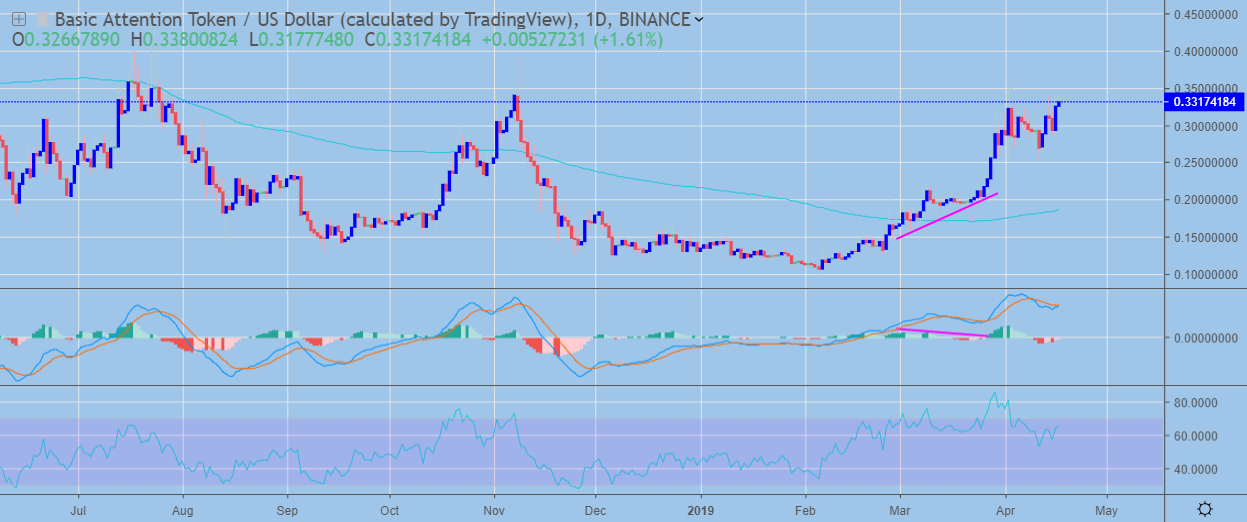 BAT / USD Daily Chart by TradingView
Pattern Watch
If a bearish triple-top pattern forms, the BAT / USD pair could decline back towards its 200-day moving average.
Relative Strength Index
The RSI indicator is bullish on the daily time frame, although a bearish head and shoulders pattern may be forming.
MACD Indicator
The MACD indicator on the daily time frame appears overstretched and is also showing bearish price divergence.
Conclusion
Basic Attention Token retains its bullish bias over both time horizons, with the inverted head and shoulders pattern on the four-hour time frame highlighting that the BAT / USD pair could still trade much higher in the near-term.
If bulls fail to breach the November 8th trading high, a bearish triple-top pattern will form on the daily time frame, which may lead to a strong downward technical correction.
To understand the basics of BAT and the Brave Browser, check out our coin guide.
For a comprehensive overview of the strengths and weaknesses of the project, head over to our DARE.