Binance Coin Price Analysis BNB / USD: A Helping Hand
Launch on a new token on Binance Launchpad helped BNB's price.

Share this article
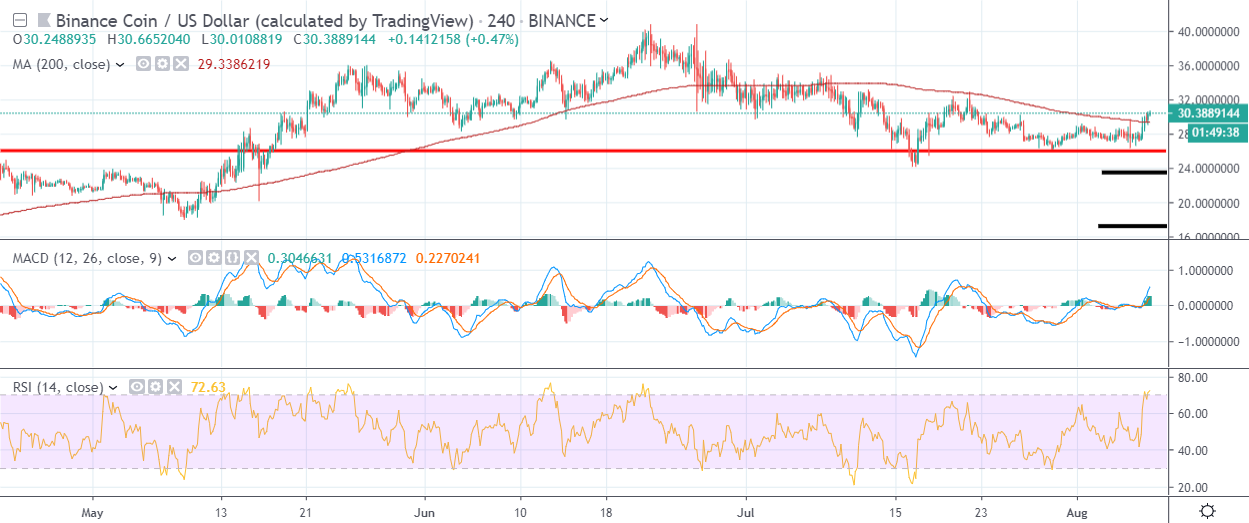
- Binance Coin has a bullish short-term bias, with the cryptocurrency trading above its 200-period moving average on the four-hour time frame
- The four-hour time frame shows that a large head and shoulders pattern is forming
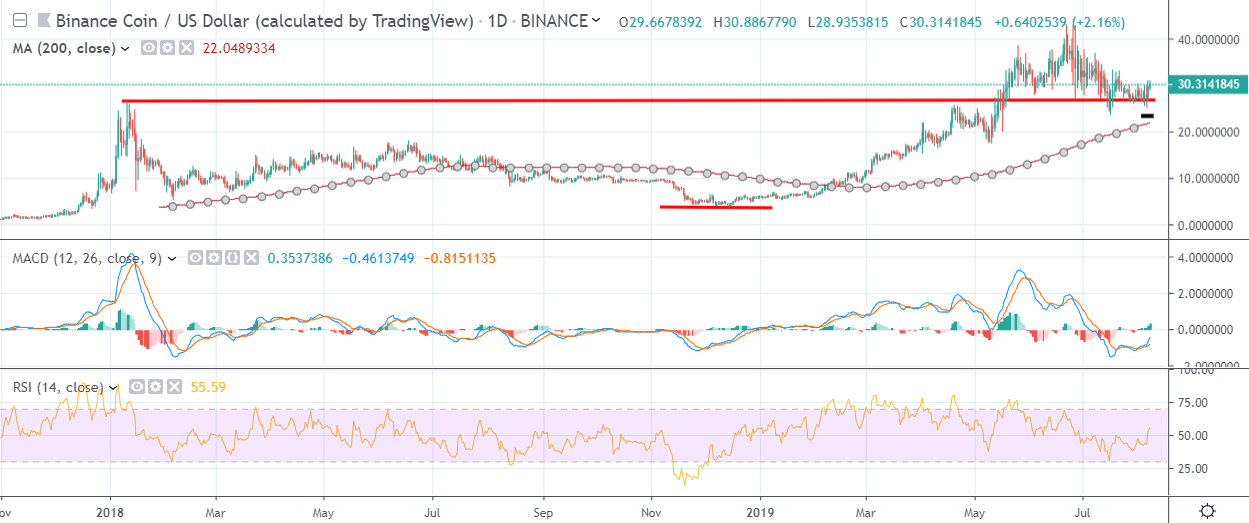
- The daily time frame shows a bullish inverted head and shoulders pattern with a $23.00 upside projection
Fundamental Analysis
BNB has gained bullish momentum after the exchange announced the next project on Binance Launchpad. BNB balances for its users will be recorded from 2019/08/09, so there is a strong incentive to buy the coin in order to get a chance to participate in the IEO.
Binance Coin / USD Short-term price analysis
Binance Coin has a bullish short-term outlook, with the cryptocurrency recovering above its 200-period moving average on the four-hour time frame.
The four-hour time frame shows that the BNB / USD pair has bounced sharply from the neckline of a large head and shoulders pattern that has a $16.00 downside projection.
Technical indicators on the four-hour time frame are bullish and continue to issue a strong buy signal.

Pattern Watch
Traders should note that a complex head and shoulders pattern could start to form on the four-hour time frame.
Relative Strength Index
The RSI Indicator is bullish on the four-hour time frame, although it has now reached overbought territory.
MACD Indicator
The MACD indicator on the four-hour time frame is bullish and continues to issue a buy signal.
Binance Coin / USD Medium-term price analysis
Binance Coin has a bullish medium-term outlook, with the BNB / USD pair still trading above its 200-day moving average on the daily time frame.
The daily time frame shows a large inverted head and shoulders pattern, with the bullish pattern holding a sizeable upside projection of around $23.00.
Technical indicators have turned bullish on the daily time frame and continue to issue buy signals.

Pattern Watch
Traders should note that a bearish head and shoulders pattern still remains present on the daily time frame.
Relative Strength Index
The RSI indicator has turned bullish on the daily time frame and shows scope for further upside.
MACD Indicator
The MACD indicator on the daily time frame is bullish and continues to issue a strong buy signal.
Conclusion
Binance coin has regained its short-term bullish status, with buyers now needing to eradicate a large head and shoulders pattern on the four-hour time frame.
If bulls can rally price towards the June monthly trading high, the daily time frame is suggesting that the BNB / USD pair could rally towards the $50.00 region.
Check out our coin guide for BNB to understand how it works.
We also conducted a deep analysis of the Binance Exchange token in our DARE.
Share this article
