Binance Coin Price Analysis BNB / USD: Falling To Critical Level
BNB is dangerously close to falling below its trend lines.

Share this article
- Binance Coin has a bearish short-term bias, with the cryptocurrency trading below its 200-period moving average on the four-hour time frame
- The four-hour time frame is showing that a bearish head and shoulders pattern has formed
- The daily time frame still shows that the BNB / USD pair is trading above breakout support
Binance Coin / USD Short-term price analysis
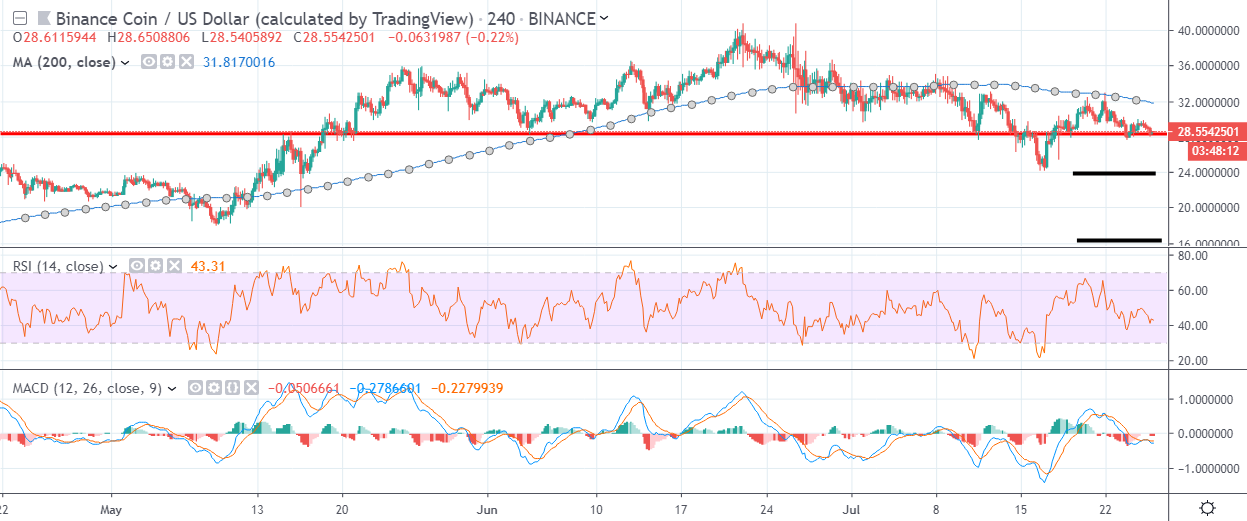
Binance Coin has a bearish short-term outlook, with the cryptocurrency still trading below its 200-period moving average on the four-hour time frame.
The four-hour time frame shows that the BNB / USD pair is now probing the neckline of a bearish head and shoulders pattern, following an earlier false breakout to the downside.
Technical indicators on the four-hour time frame are bearish and highlight that the BNB / USD pair is back under downside pressure.
Pattern Watch
Traders should note that the 16.00 level is the overall target of the bearish head and shoulders pattern on the four-hour time frame.
Relative Strength Index
The RSI Indicator is bullish on the four-hour time frame is once again turning bearish after a brief technical correction.
MACD Indicator
The MACD indicator on the four-hour time frame is bearish and continues to issue a sell signal.
Binance Coin / USD Medium-term price analysis
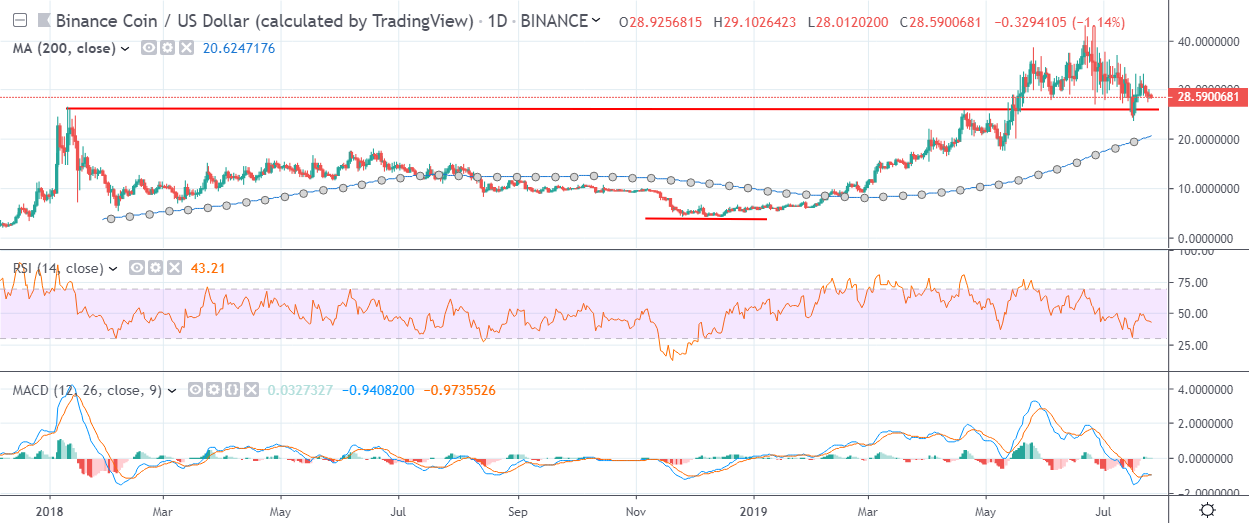
Binance Coin has a bullish medium-term outlook, with the BNB / USD pair still trading above key support on the daily time frame.
The daily time frame continues to show that a valid inverted head and shoulders pattern remains present, with the BNB / USD pair holding above breakout support.
Technical indicators have turned bearish on the daily time frame and continue to issue sell signals.
Pattern Watch
Traders should note that a bearish head and shoulders pattern can also be seen on the daily time frame.
Relative Strength Index
The RSI indicator is bearish on the daily time frame and still shows scope for further downside.
MACD Indicator
The MACD indicator on the daily time frame is bearish, although it is starting to appear oversold.
Conclusion
Binance Coin is once again coming under pressure in the short-term, with sellers probing the neckline of the bearish pattern with a significant downside projection.
Buyers will have to work hard to maintain the BNB / USD pair’s medium-term bullish status and keep price above critical neckline support on the daily time frame.
Check out our coin guide for BNB to understand how it works.
We also conducted a deep analysis of the Binance Exchange token in our DARE.
Share this article
